FAQ section examples
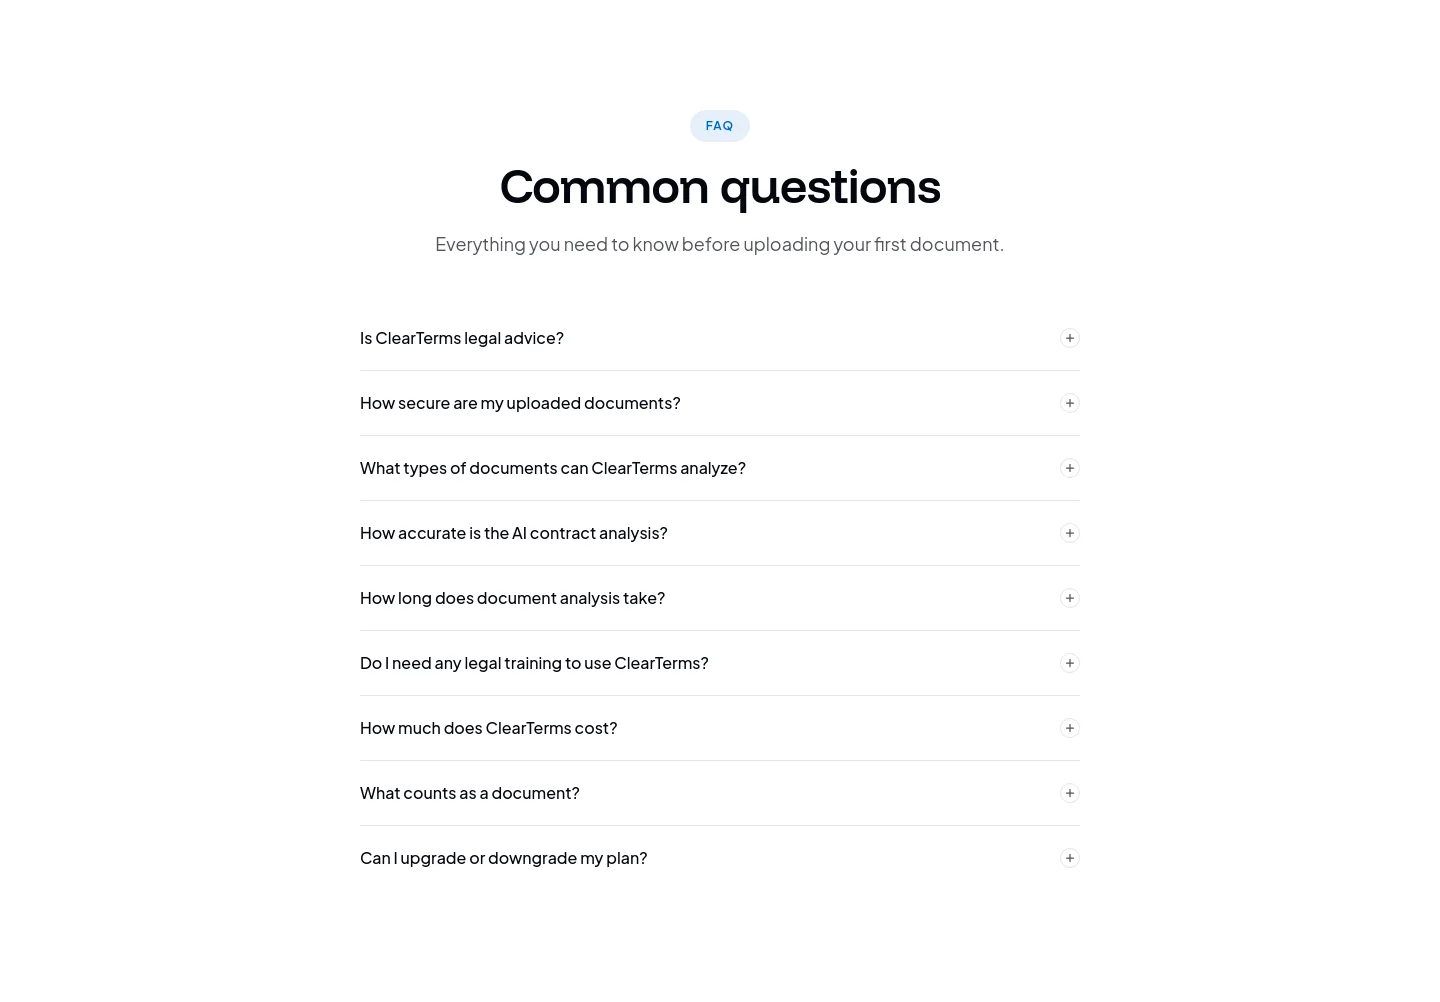
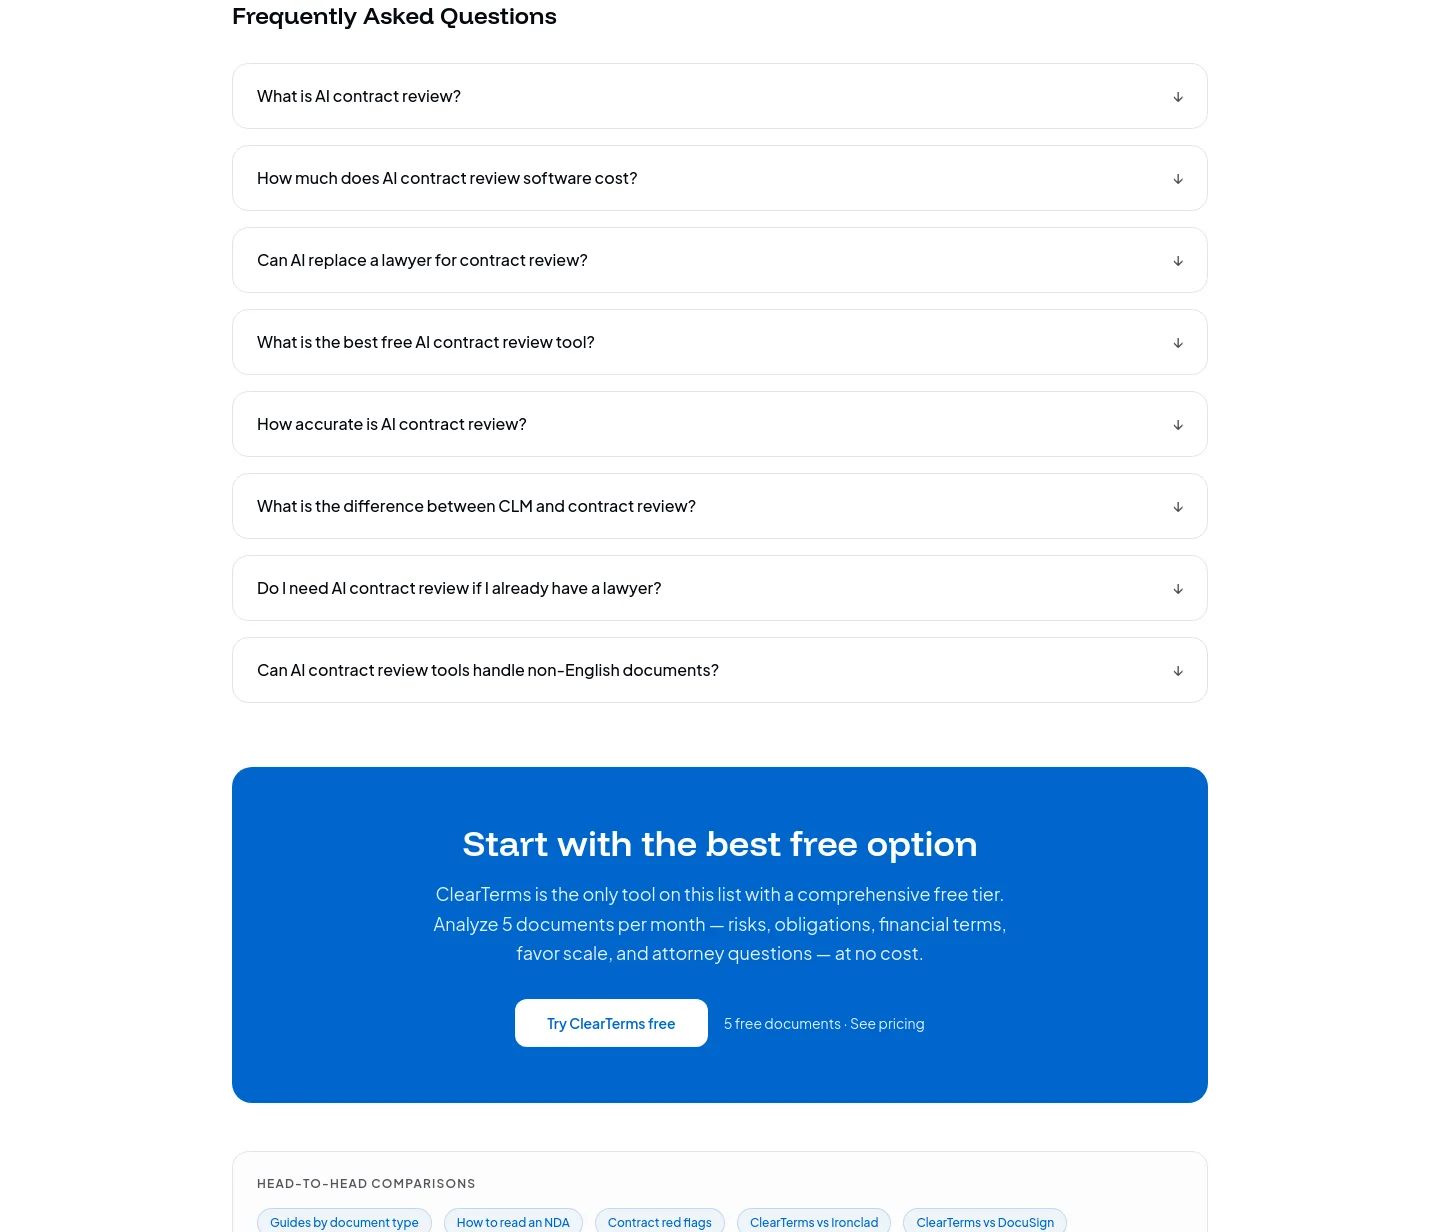
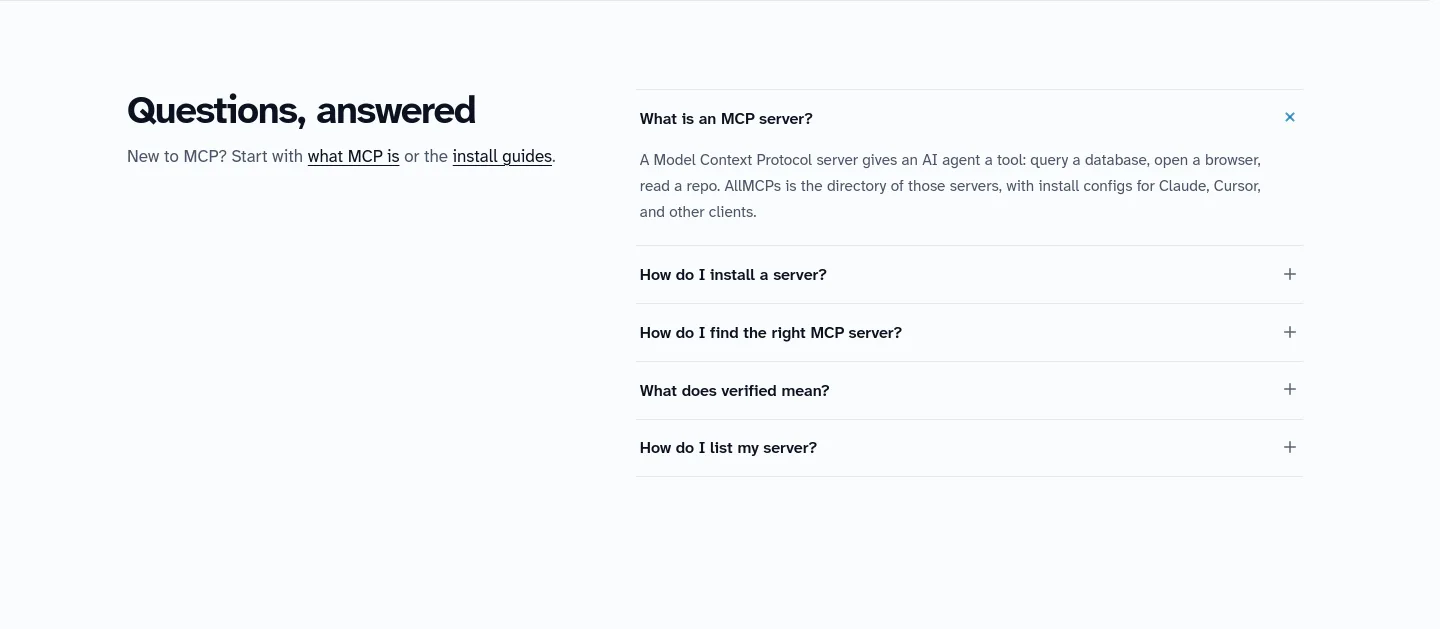
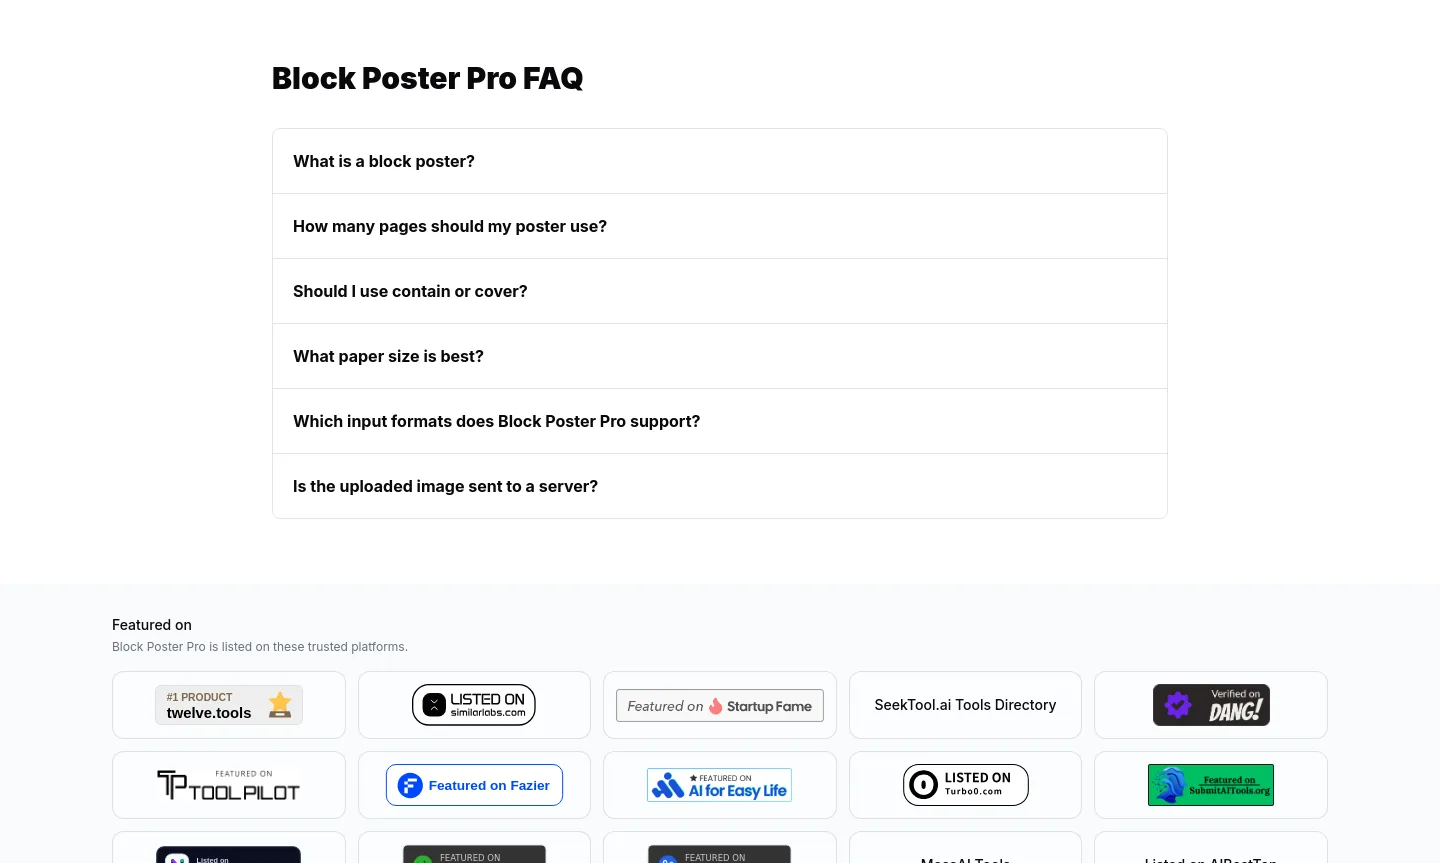
Objections, answered one at a time. The section where doubt goes to get resolved.
No sections match these filters.
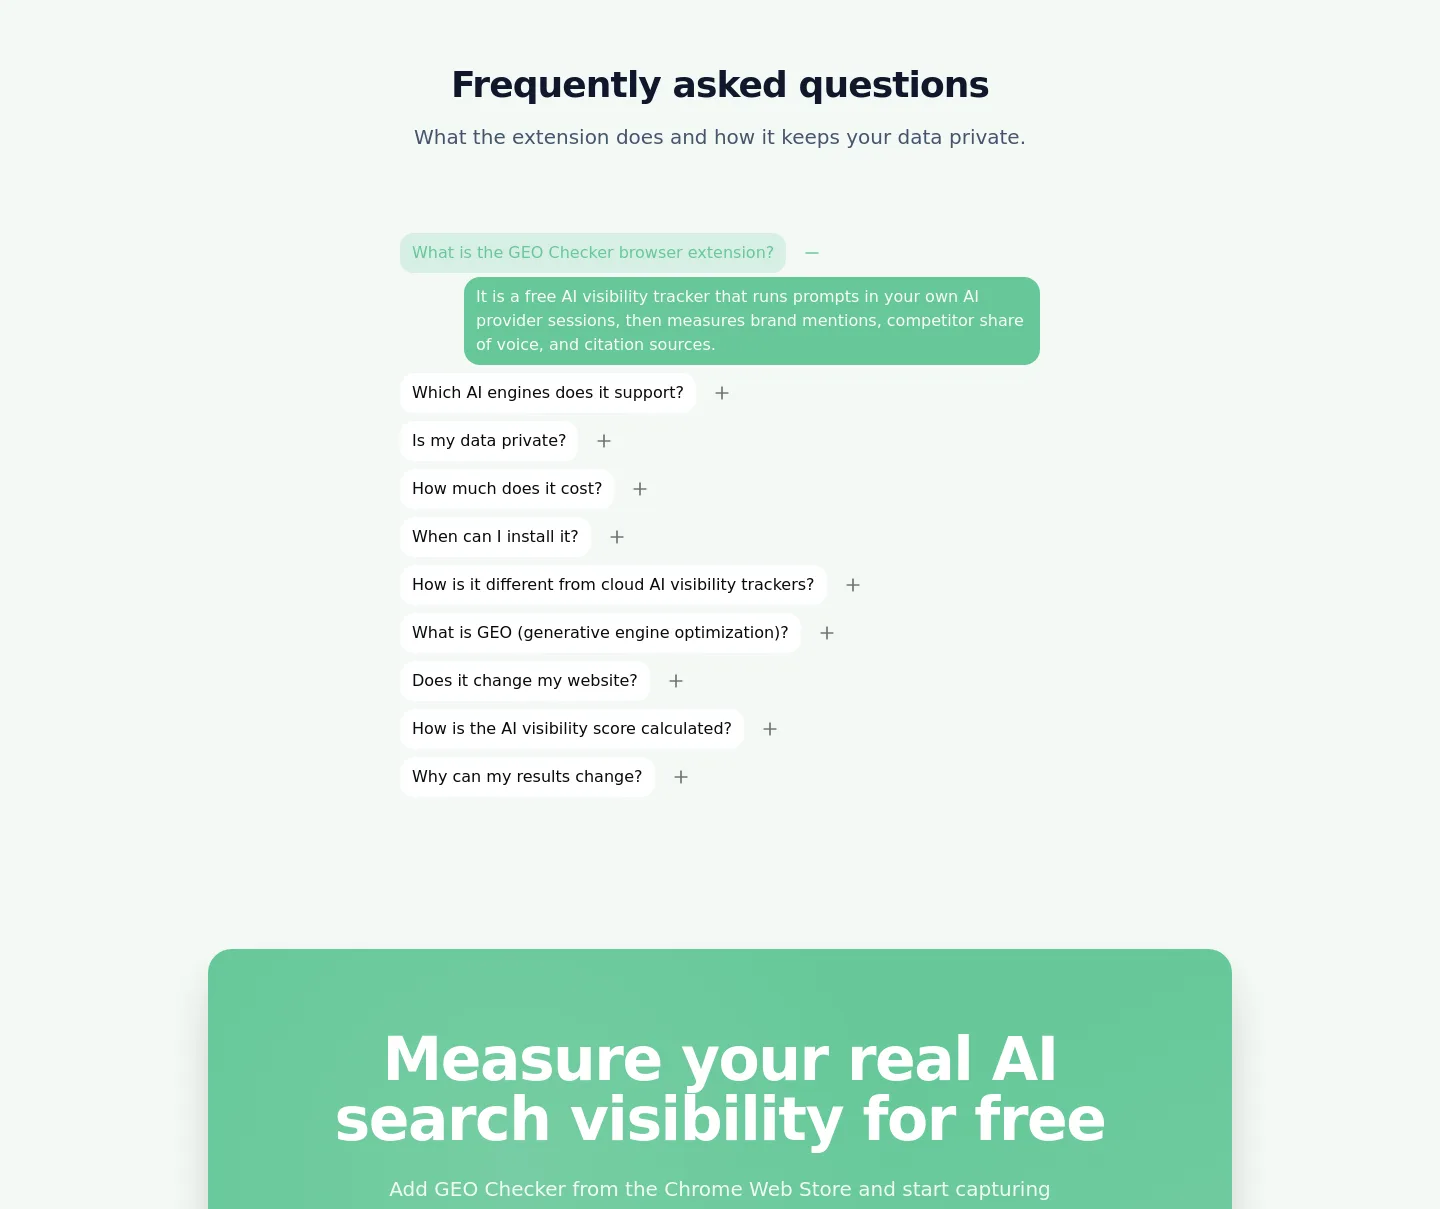
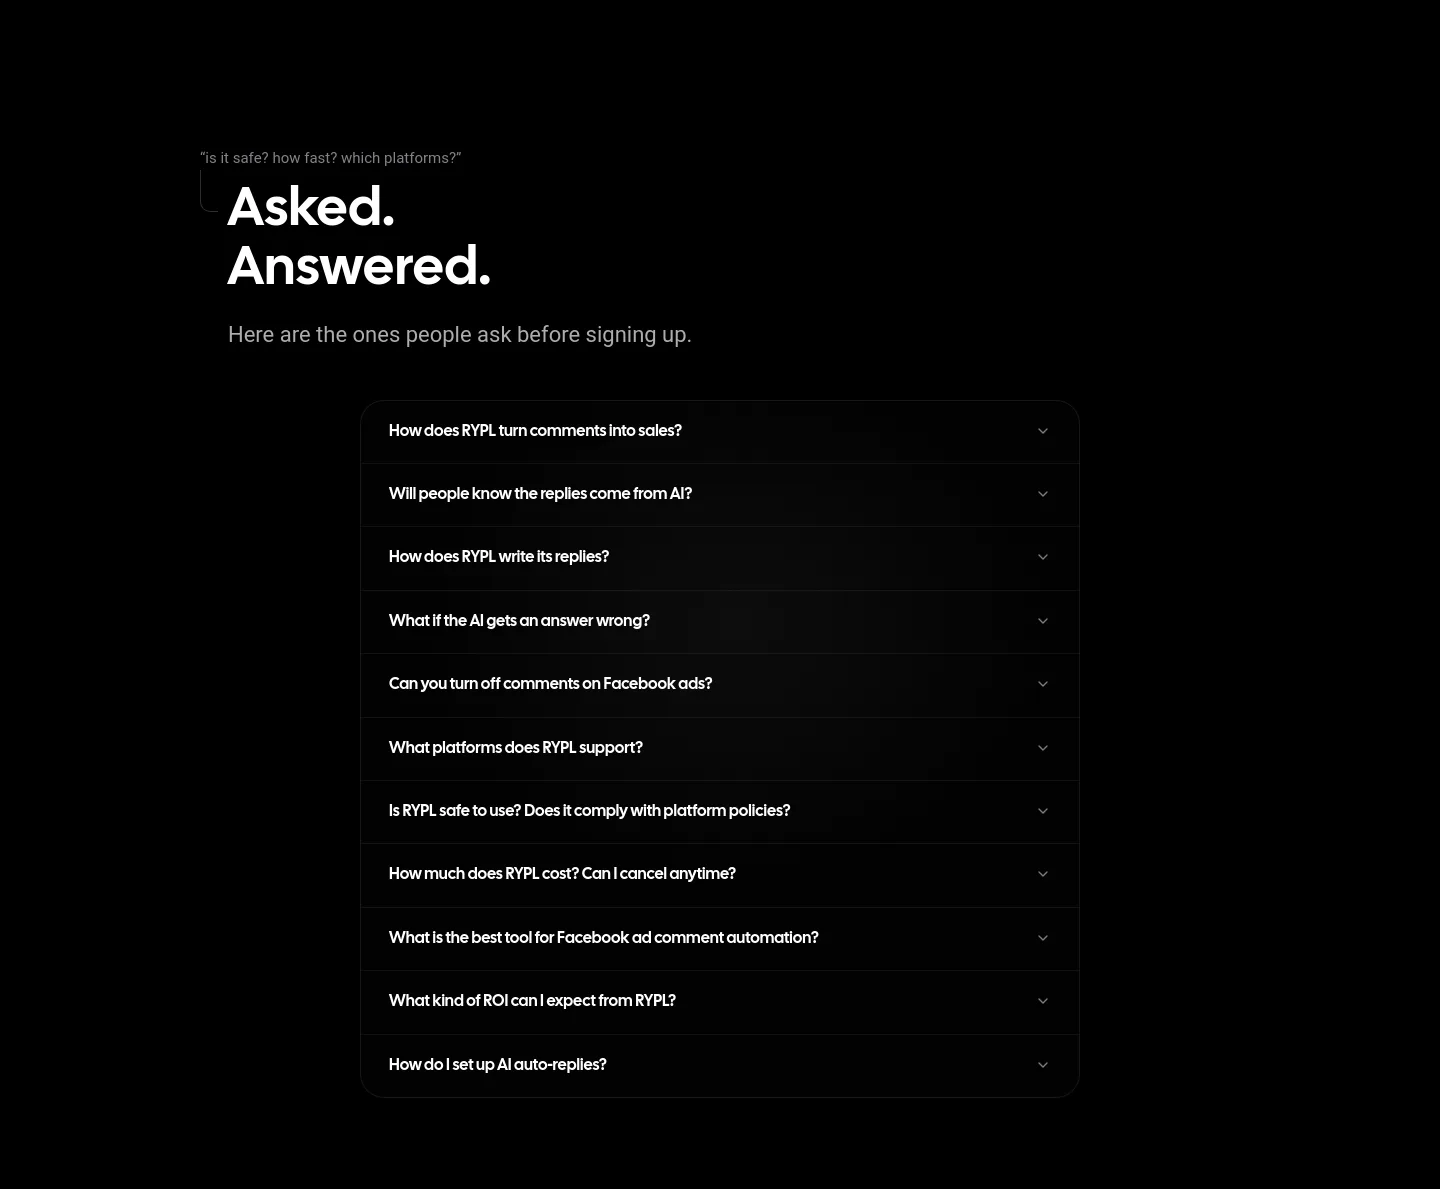
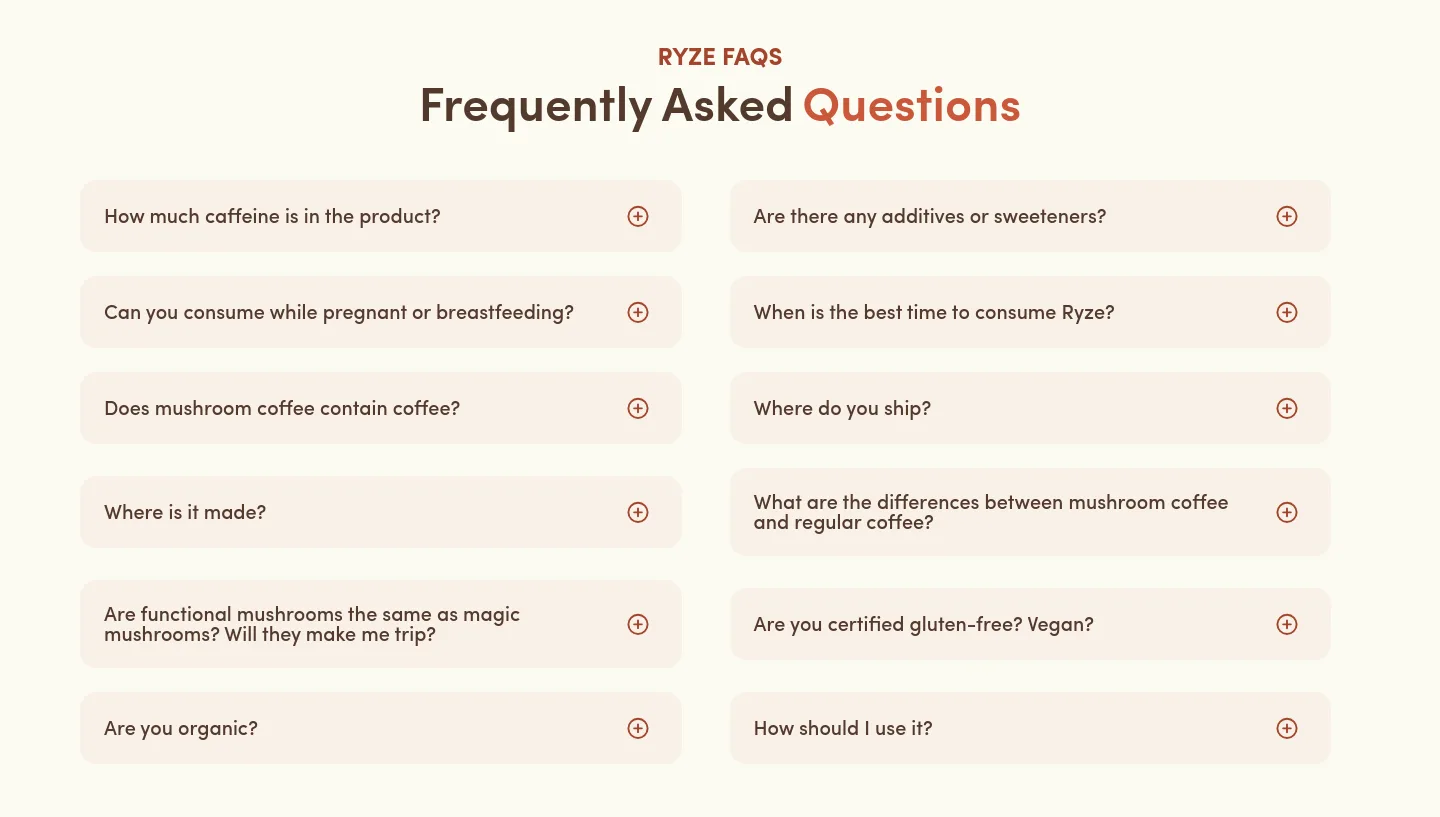
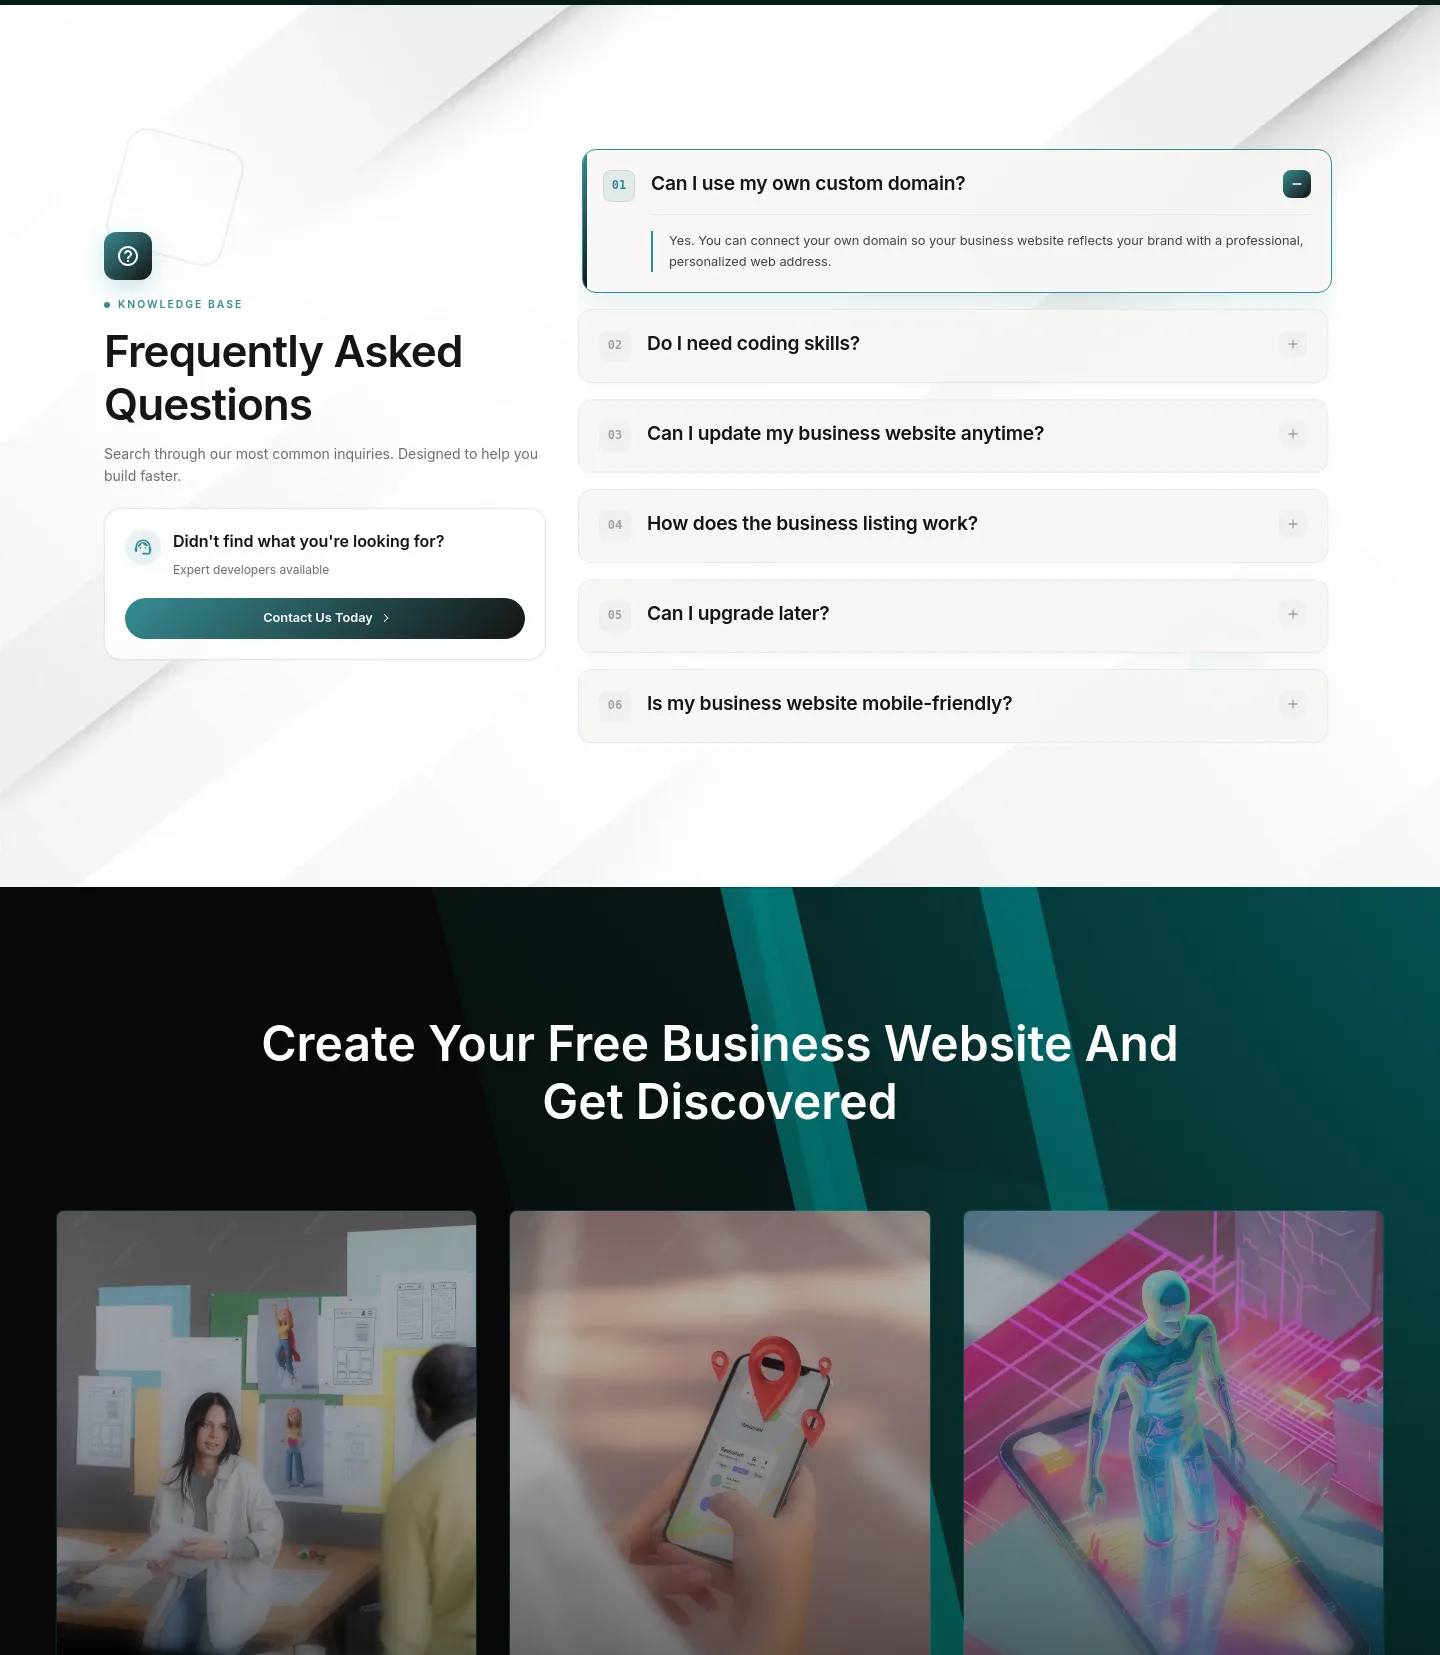
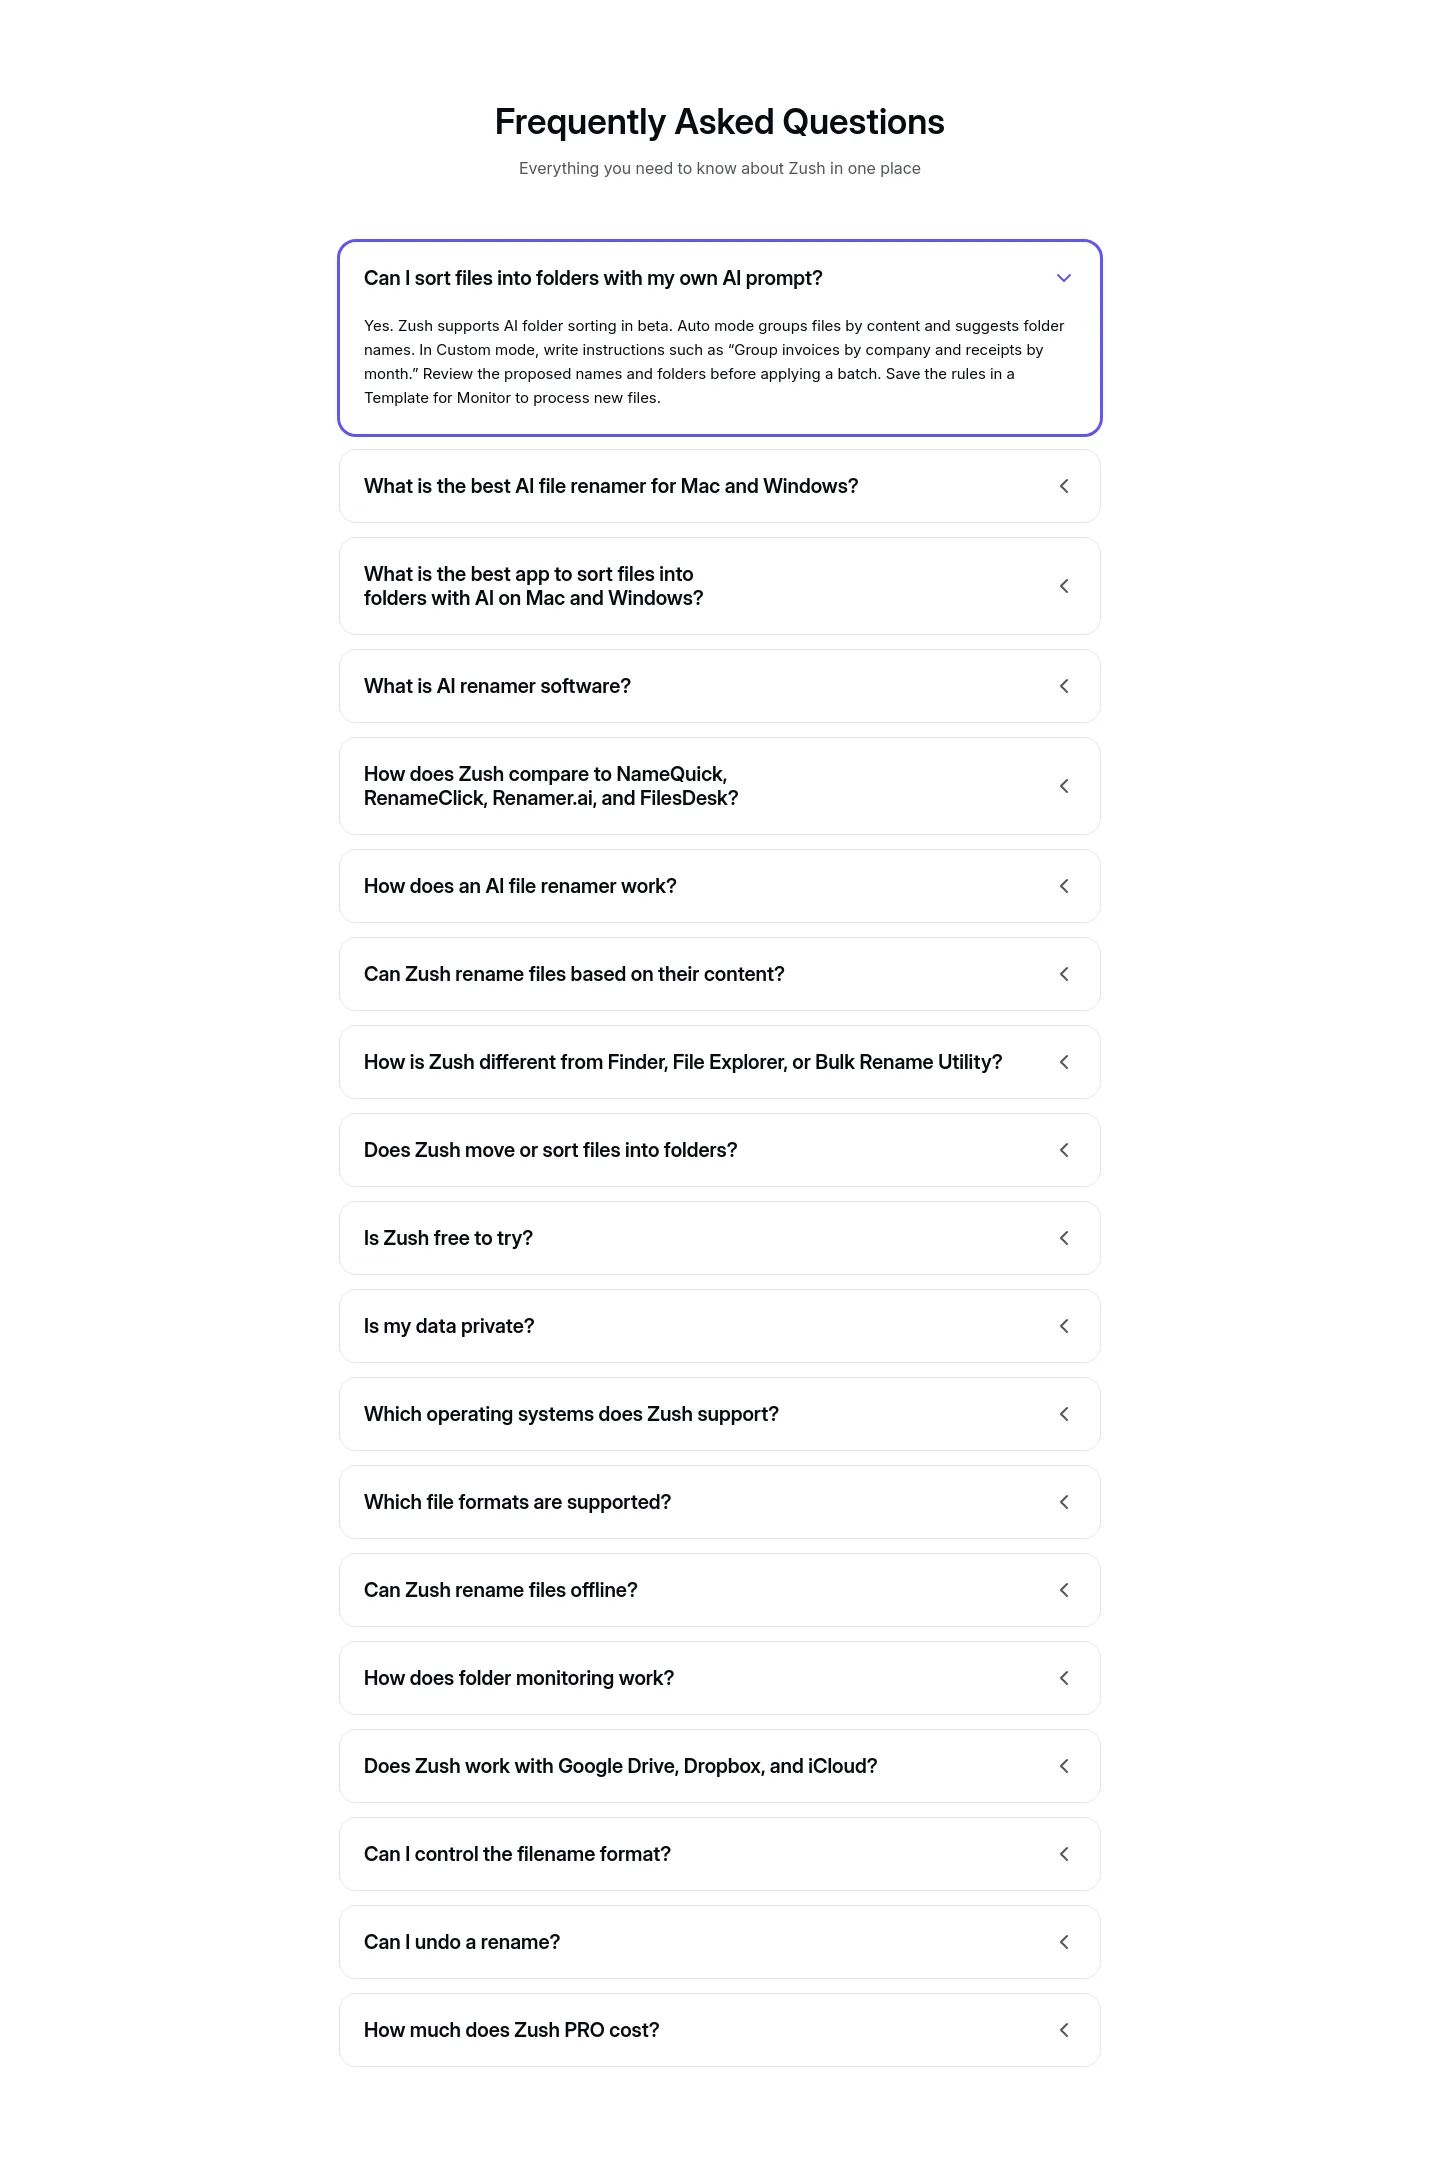
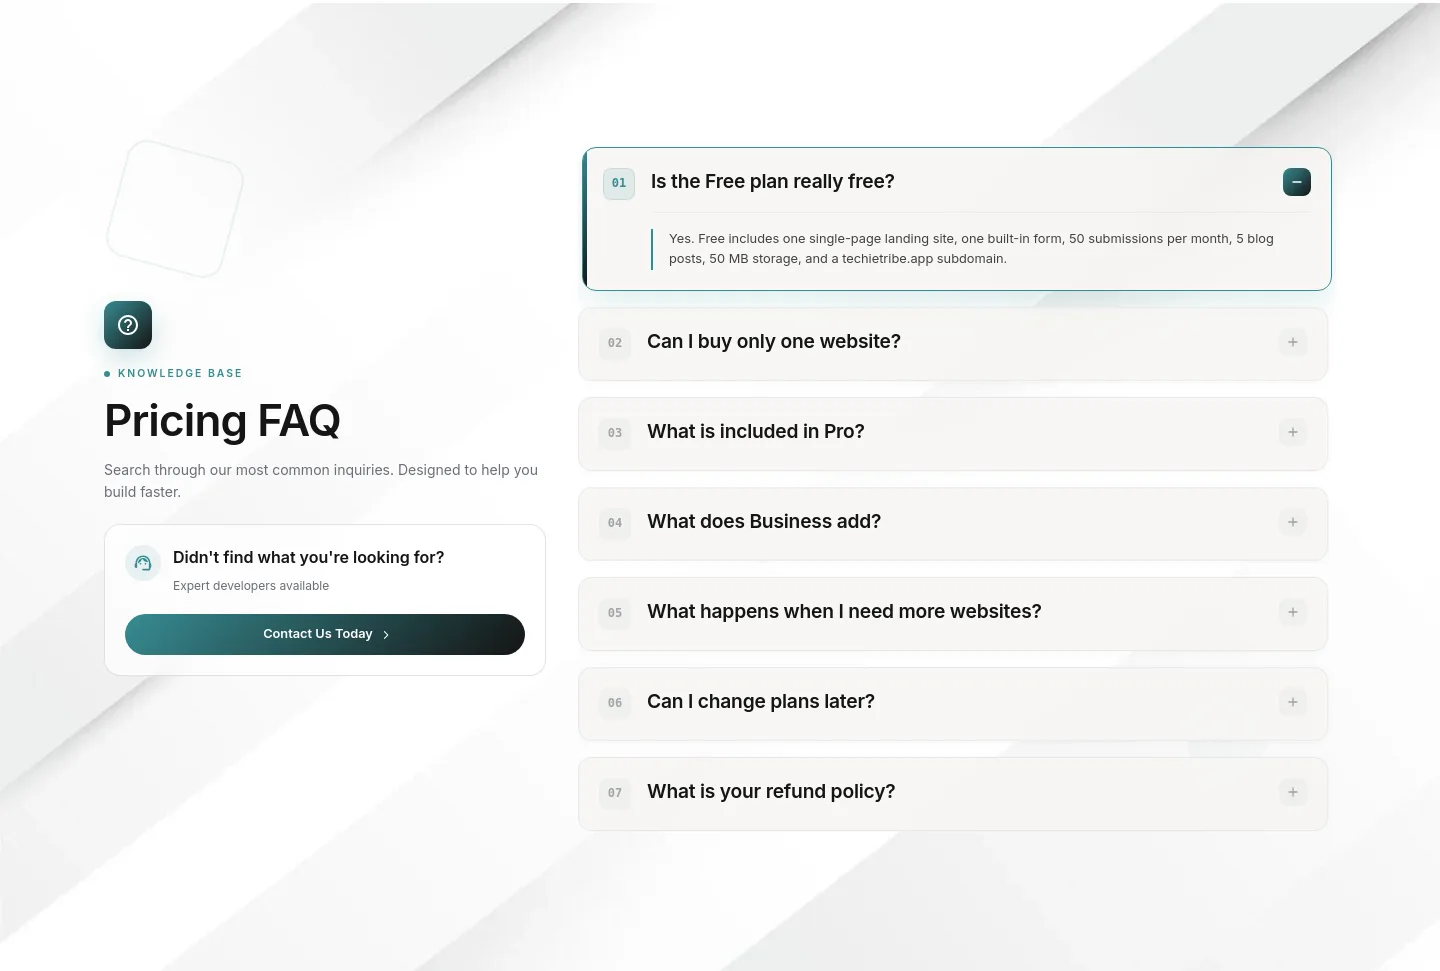
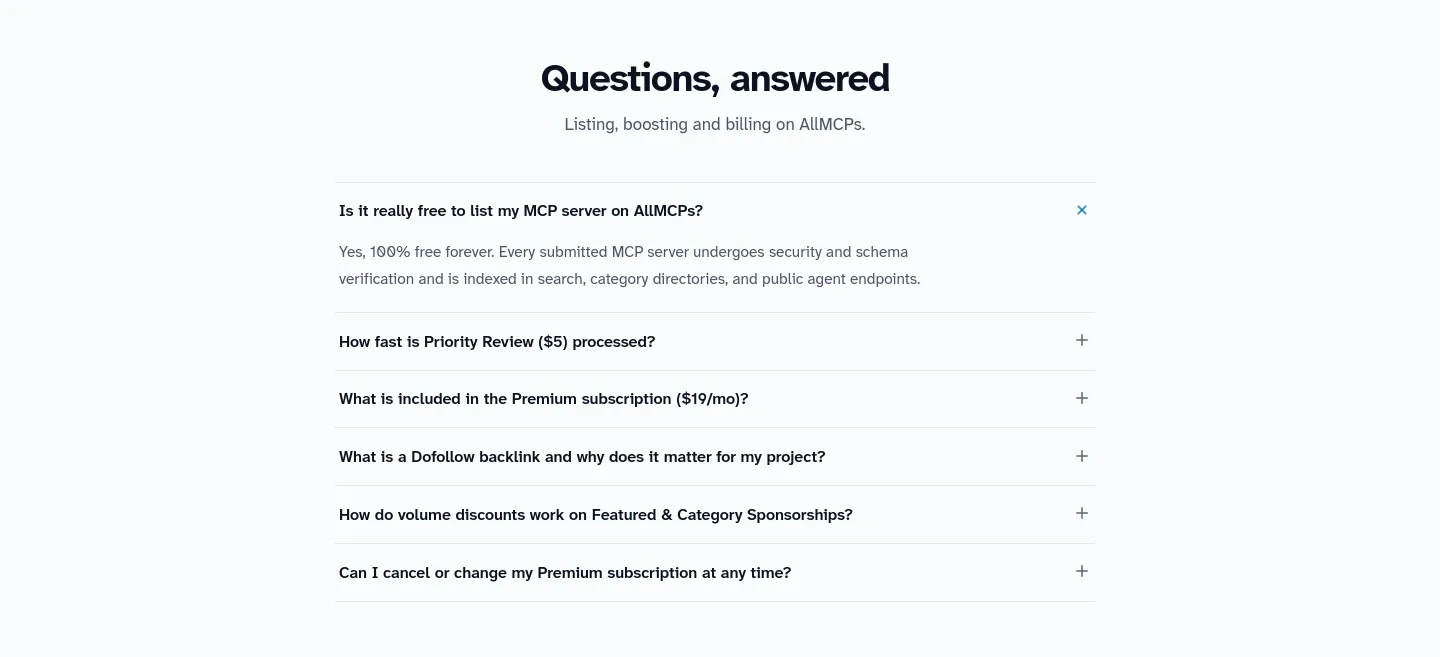
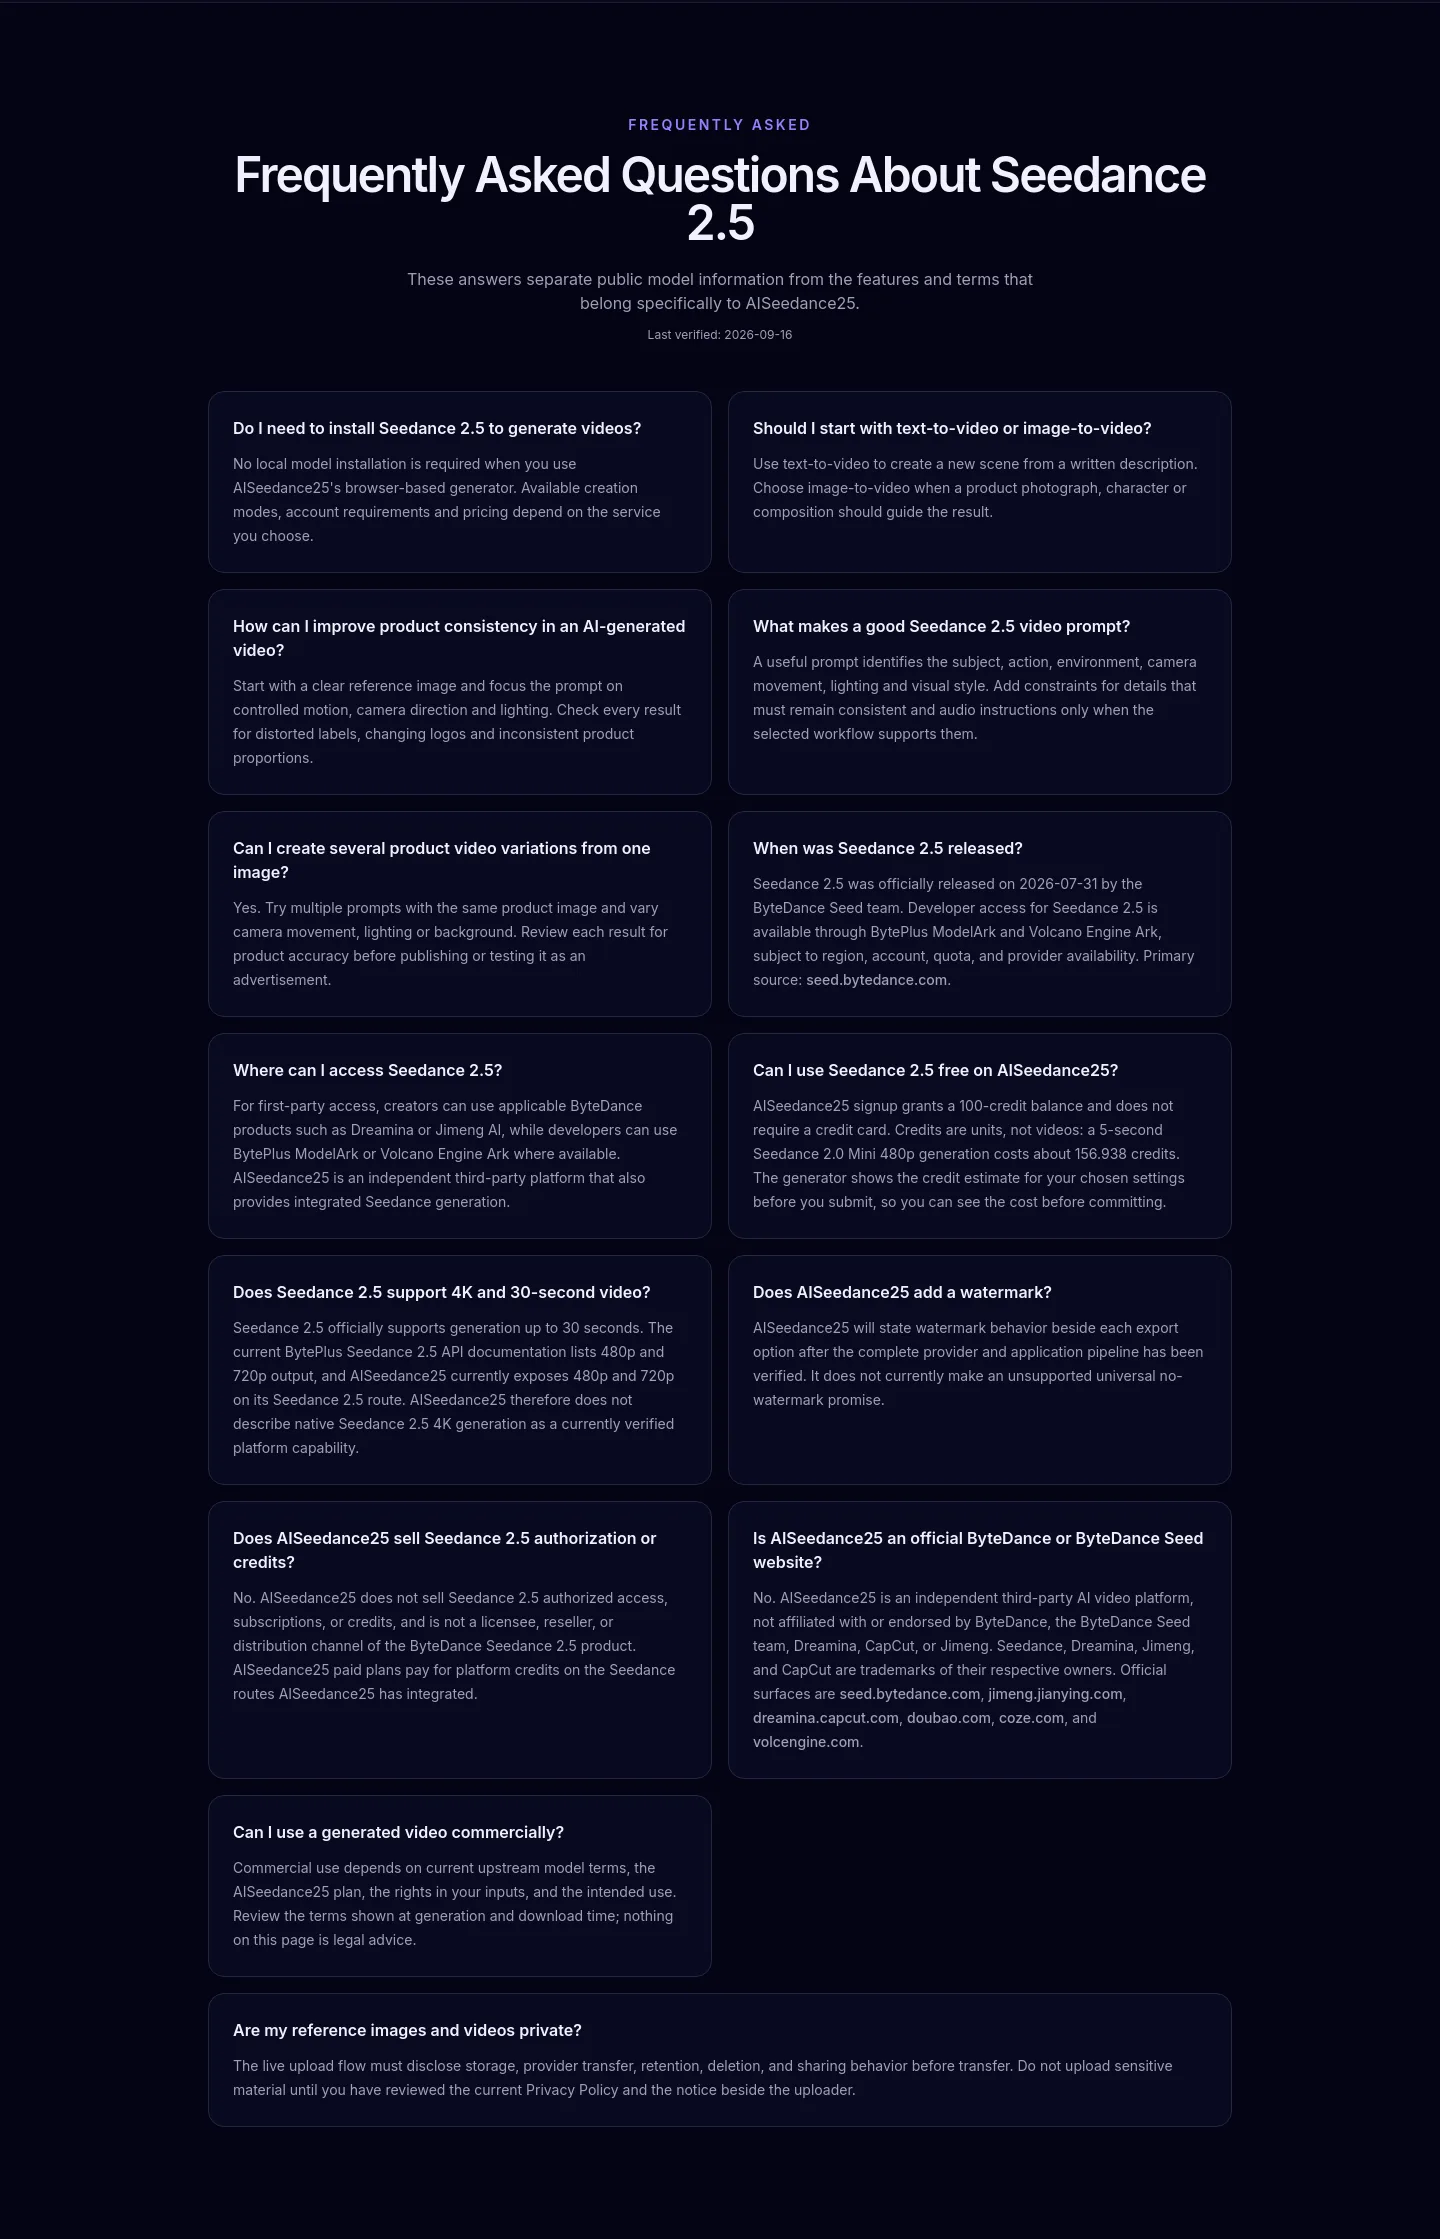
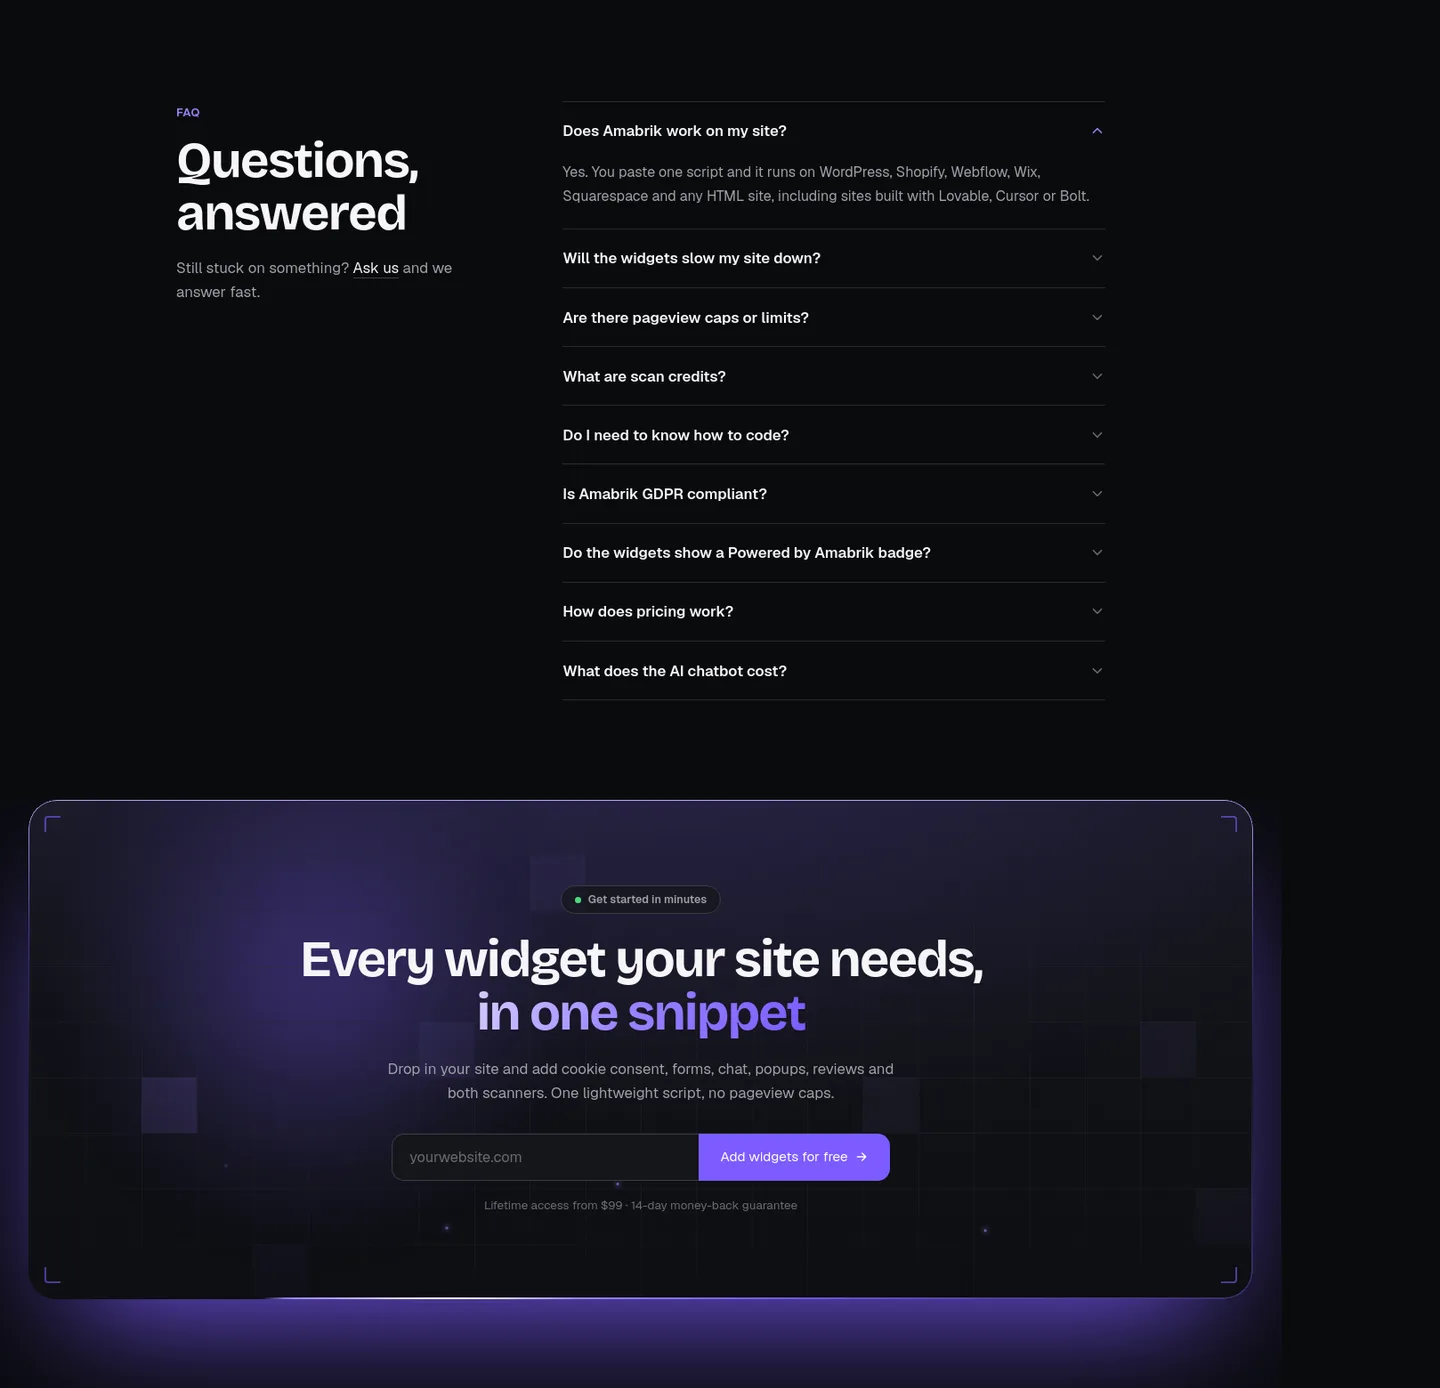
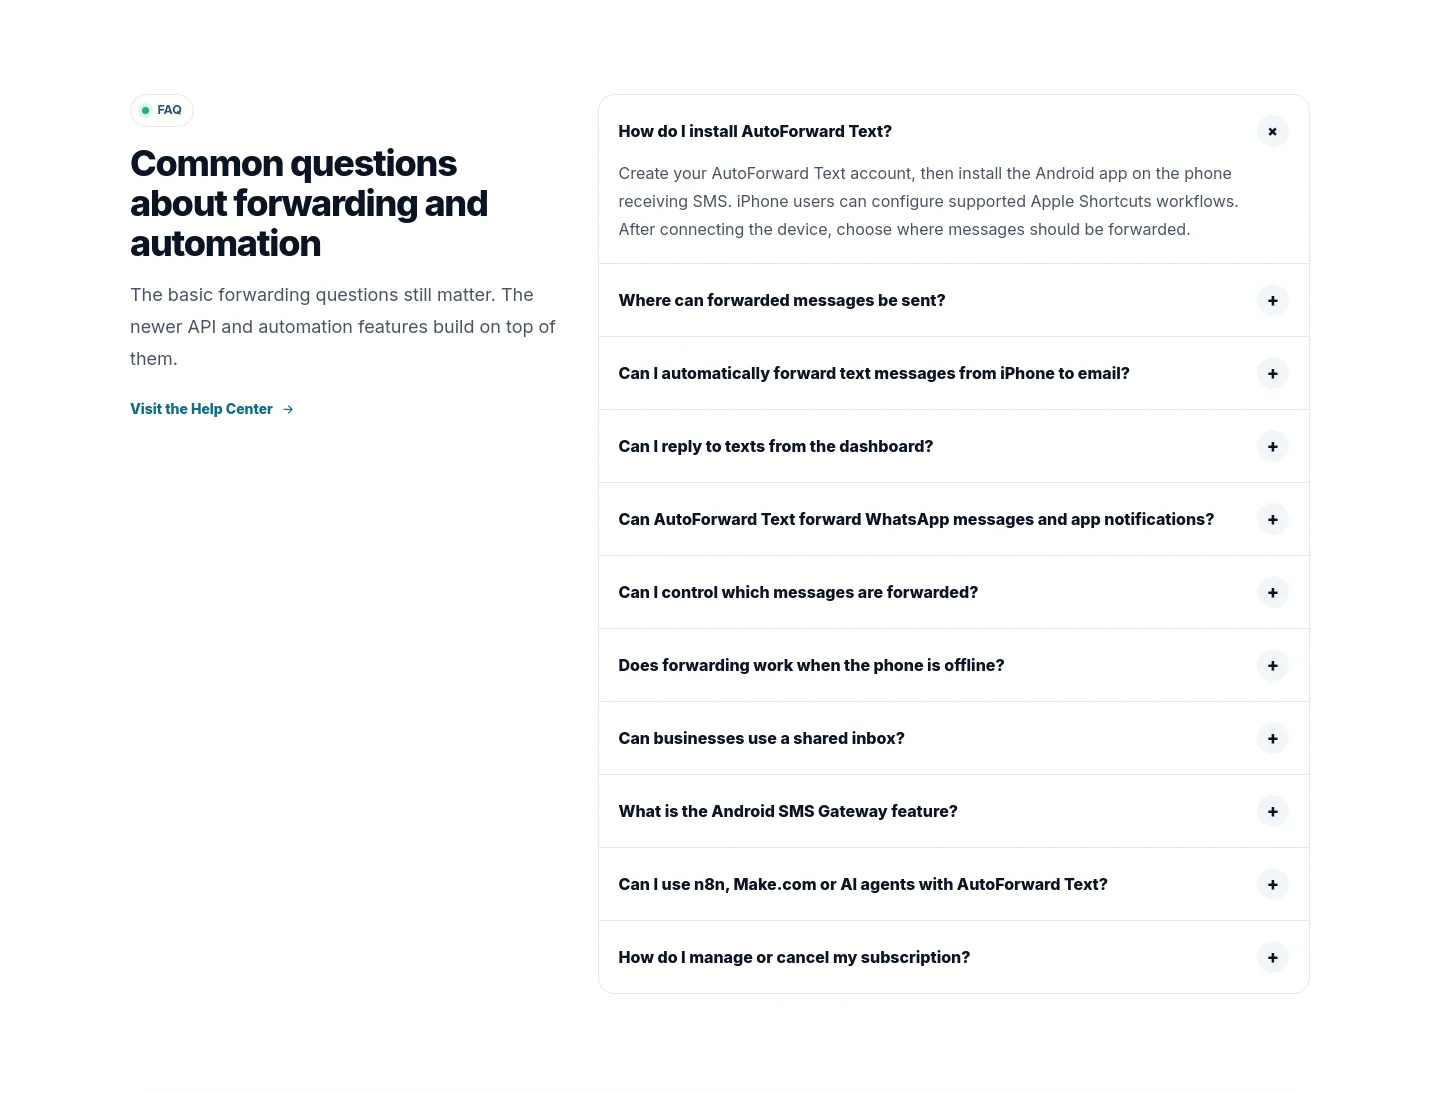
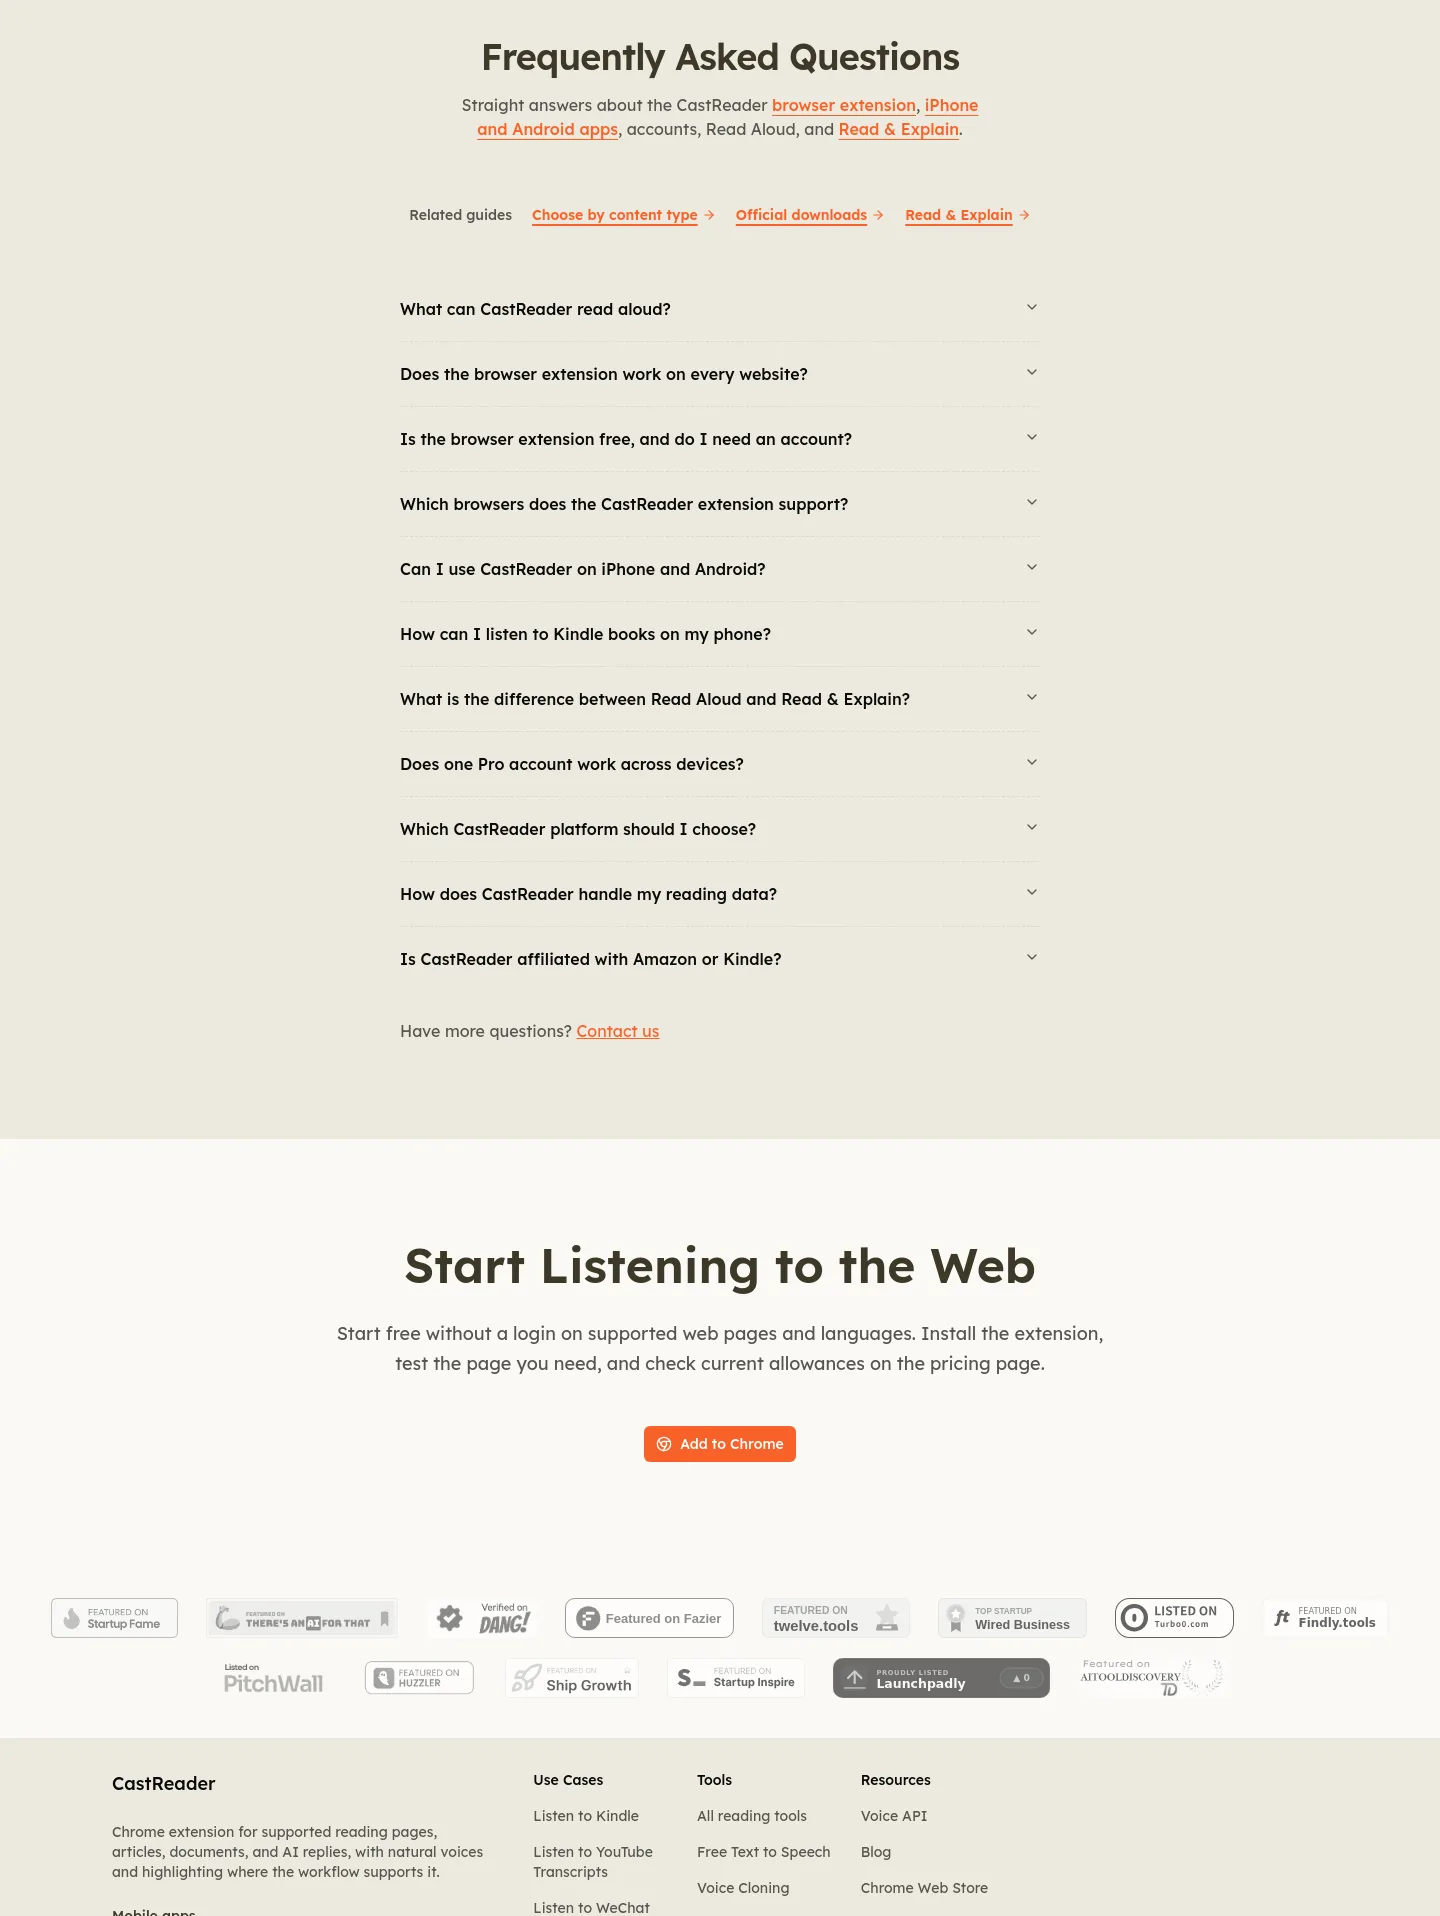
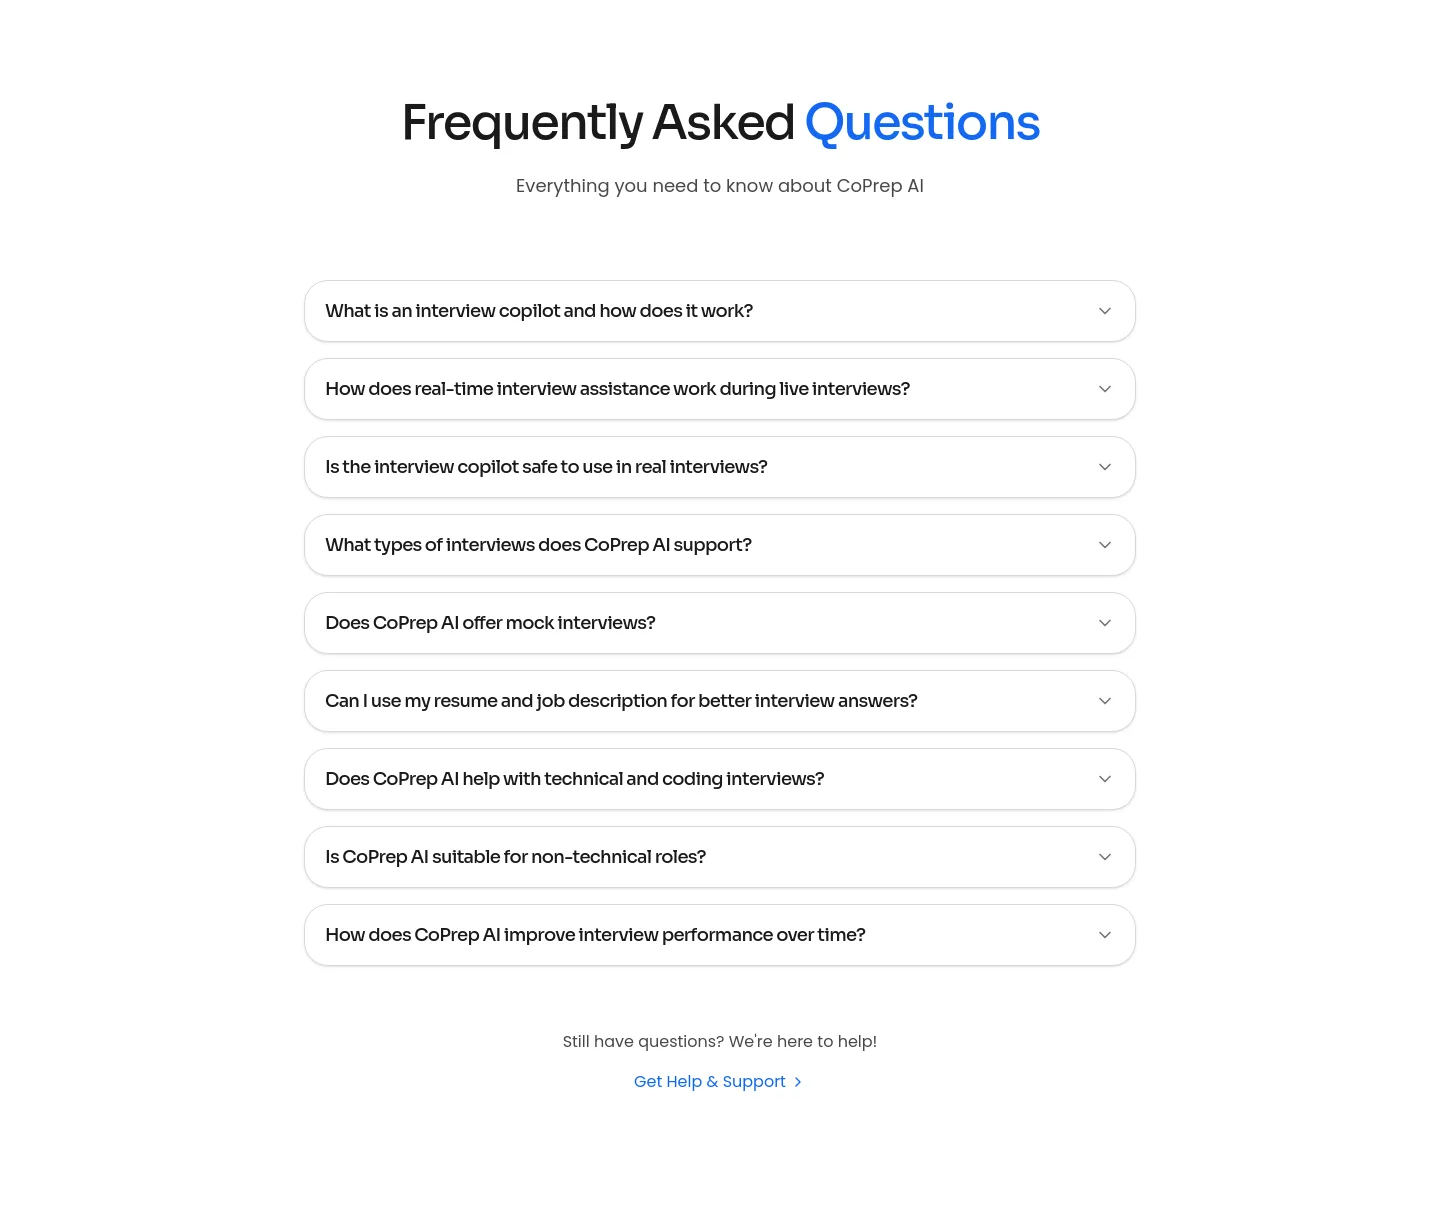
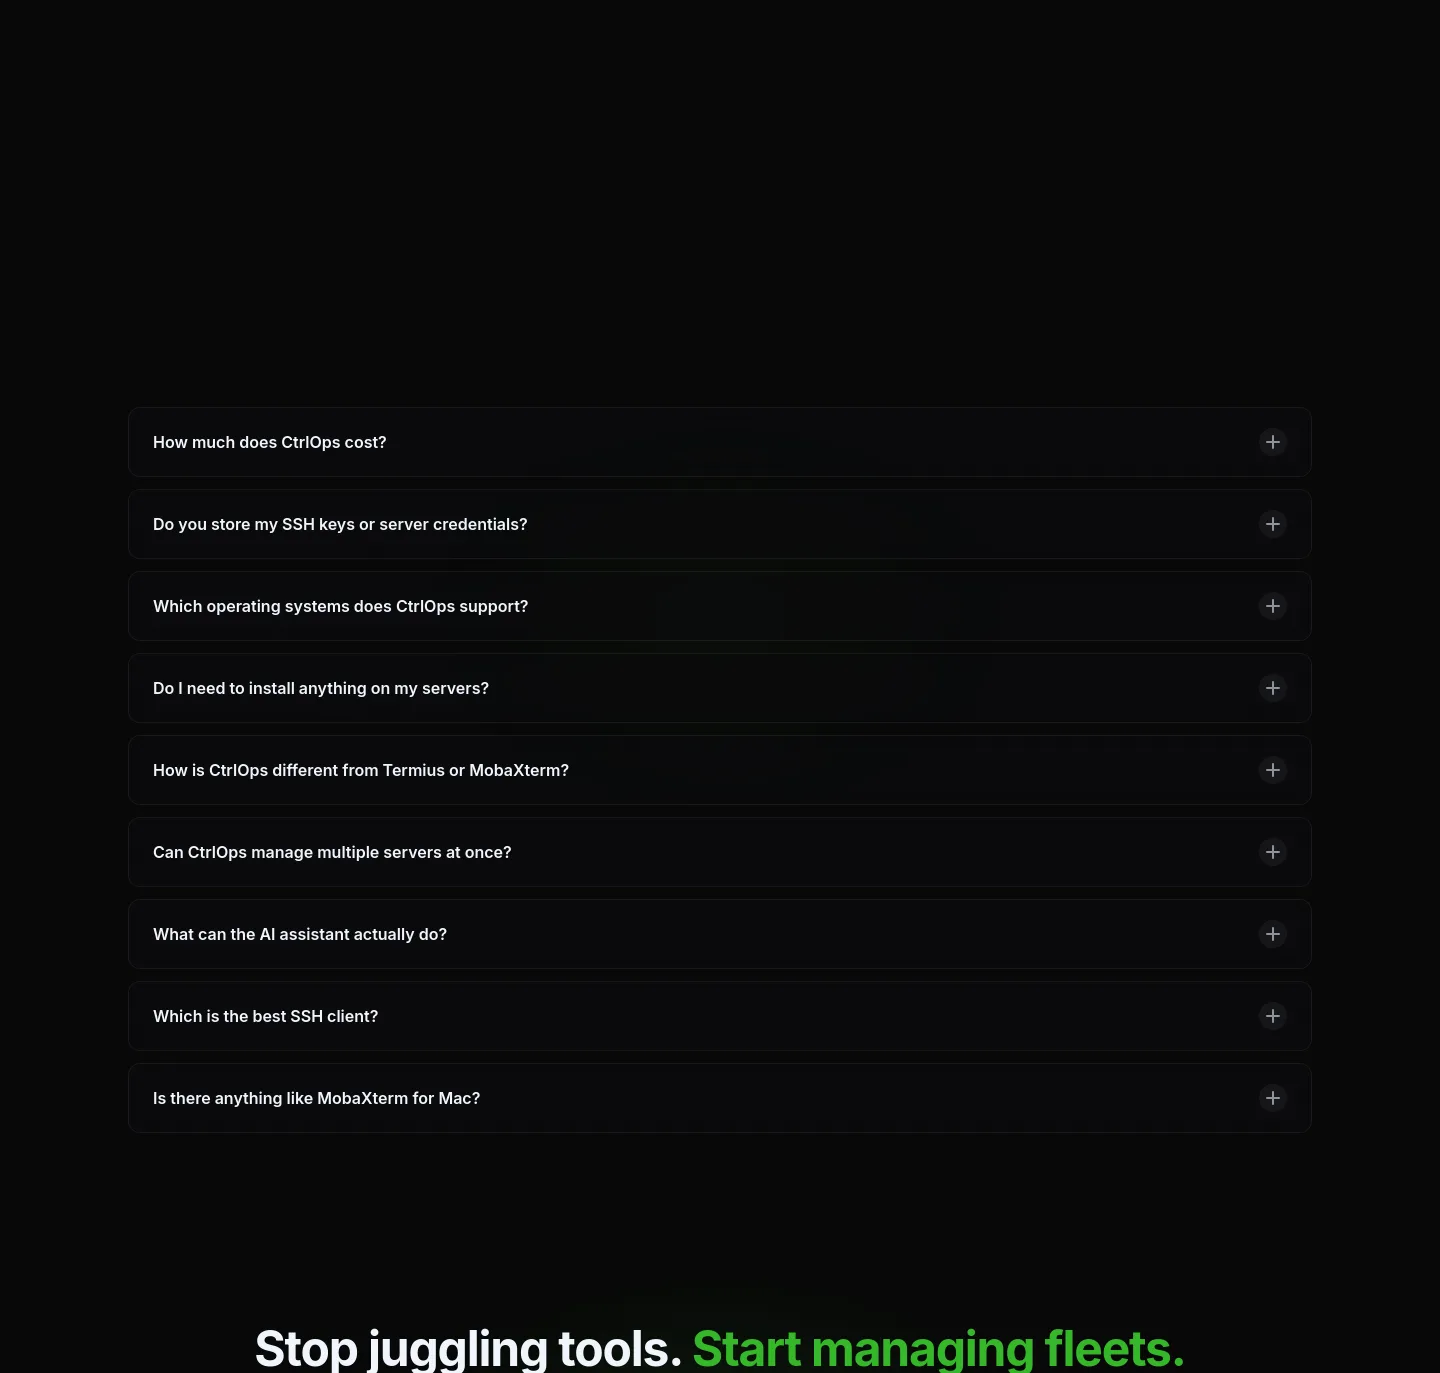
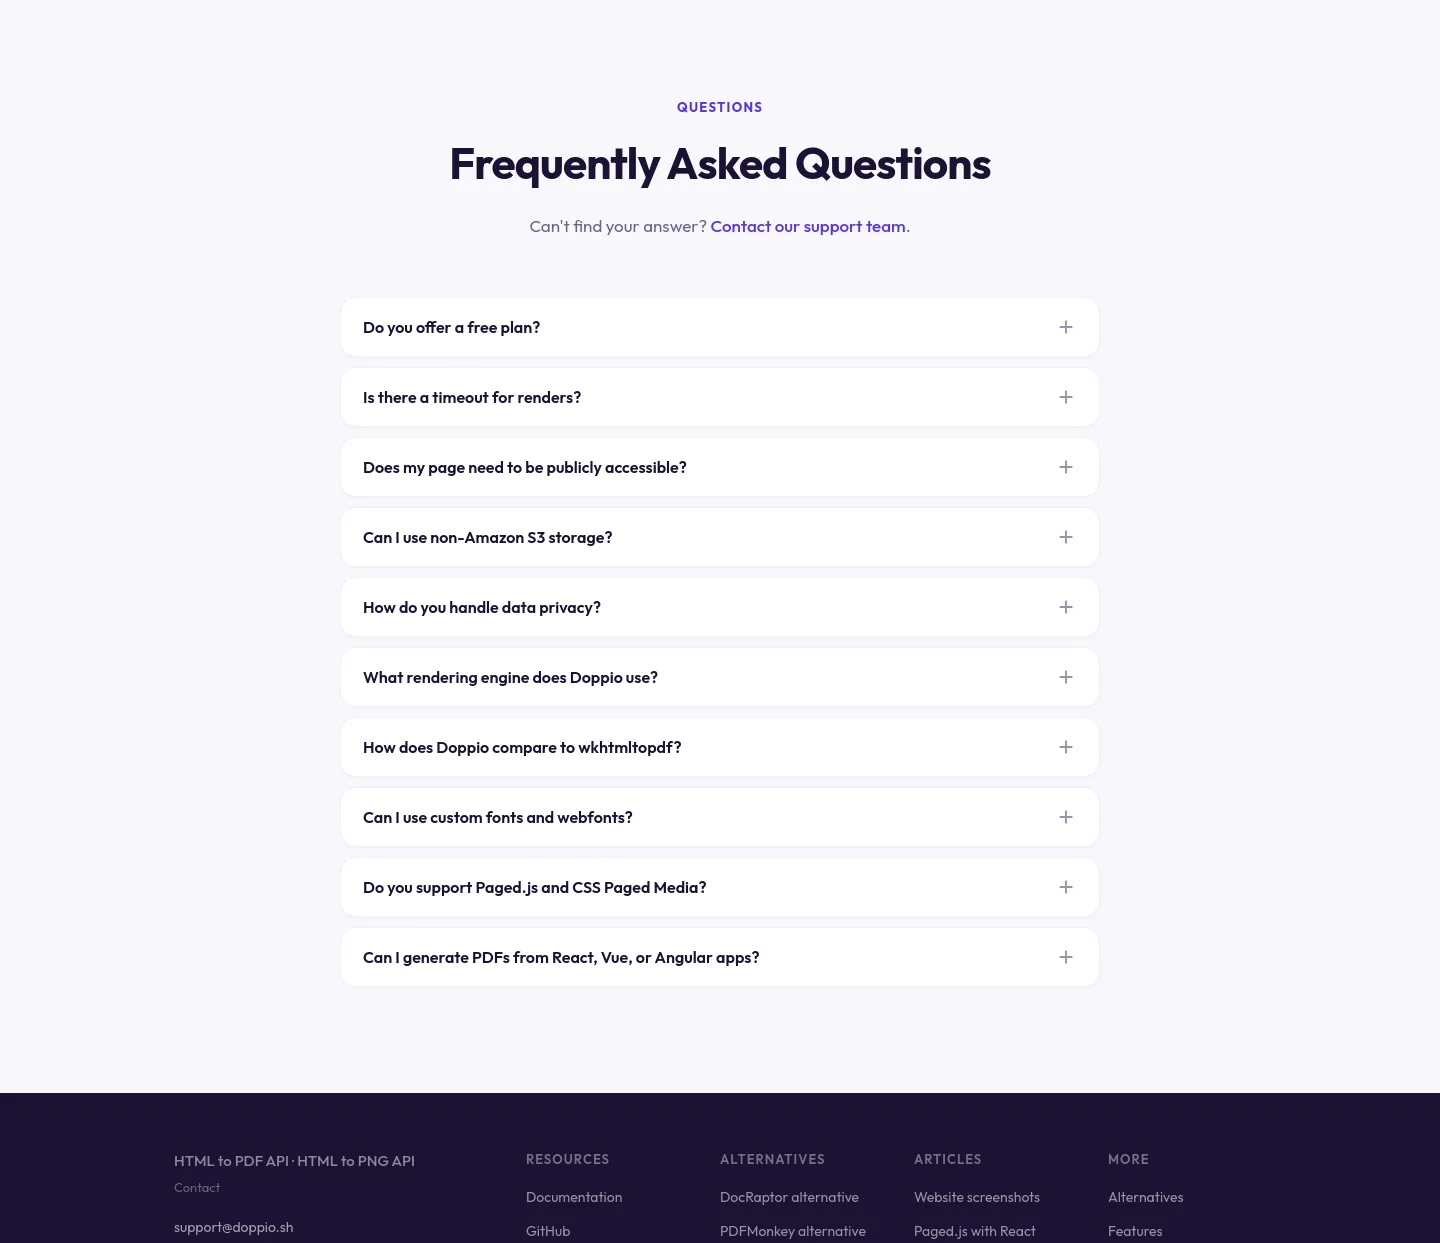
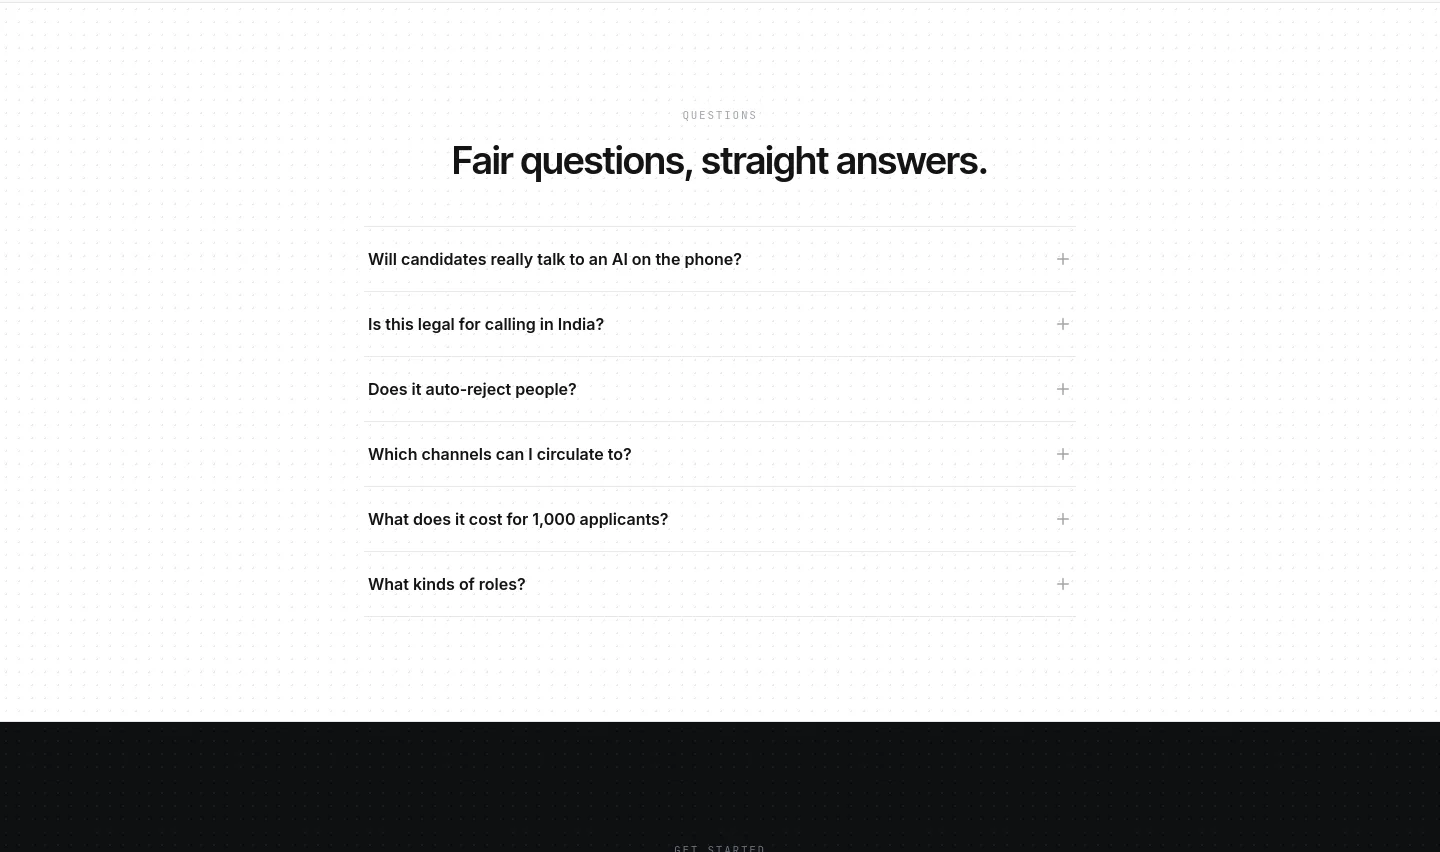
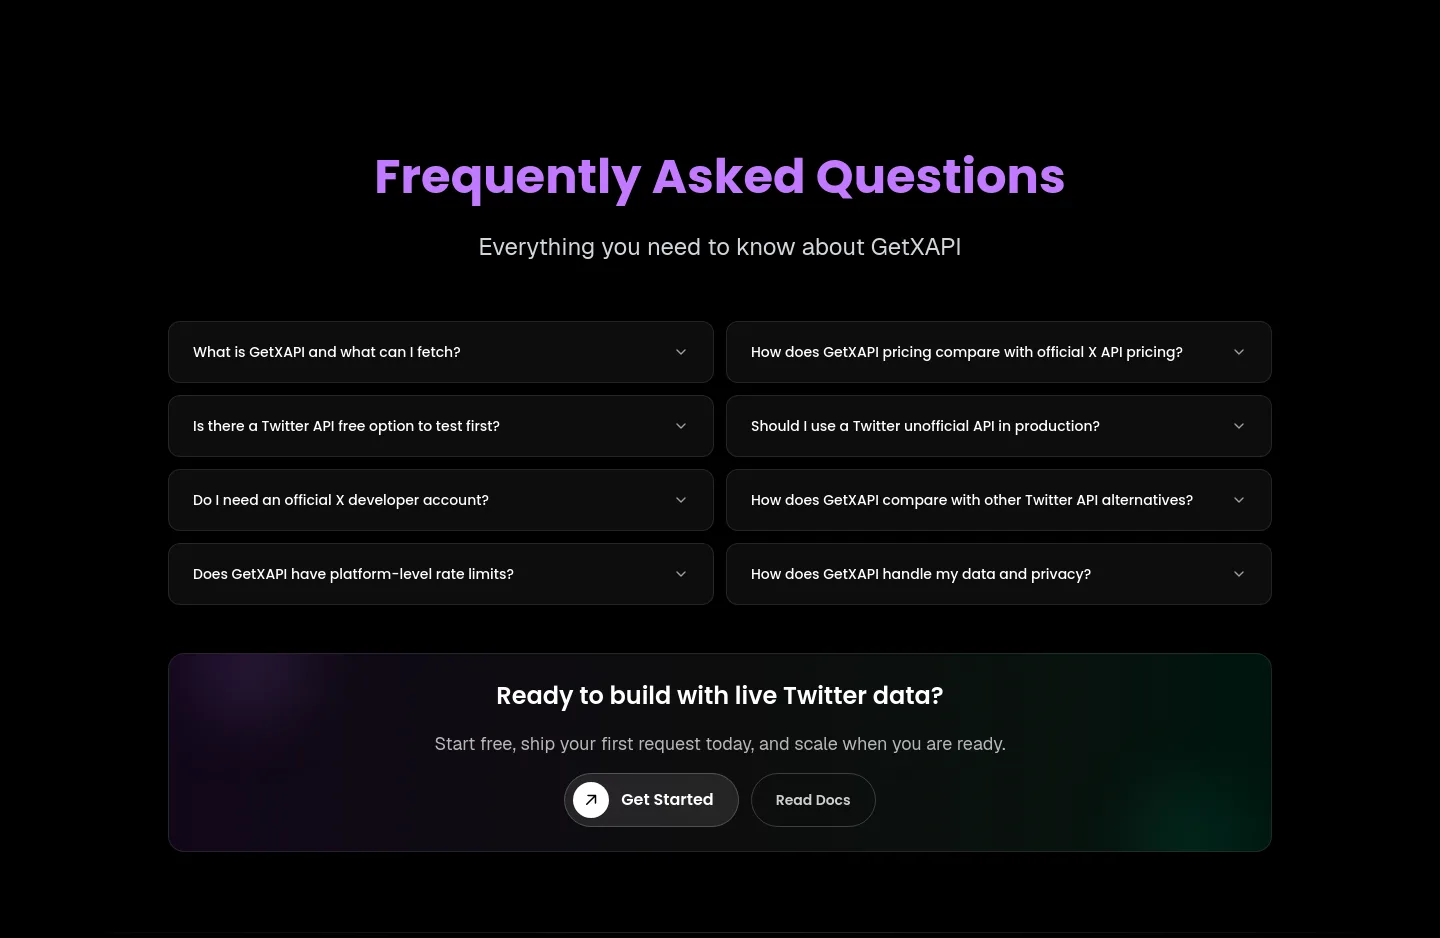
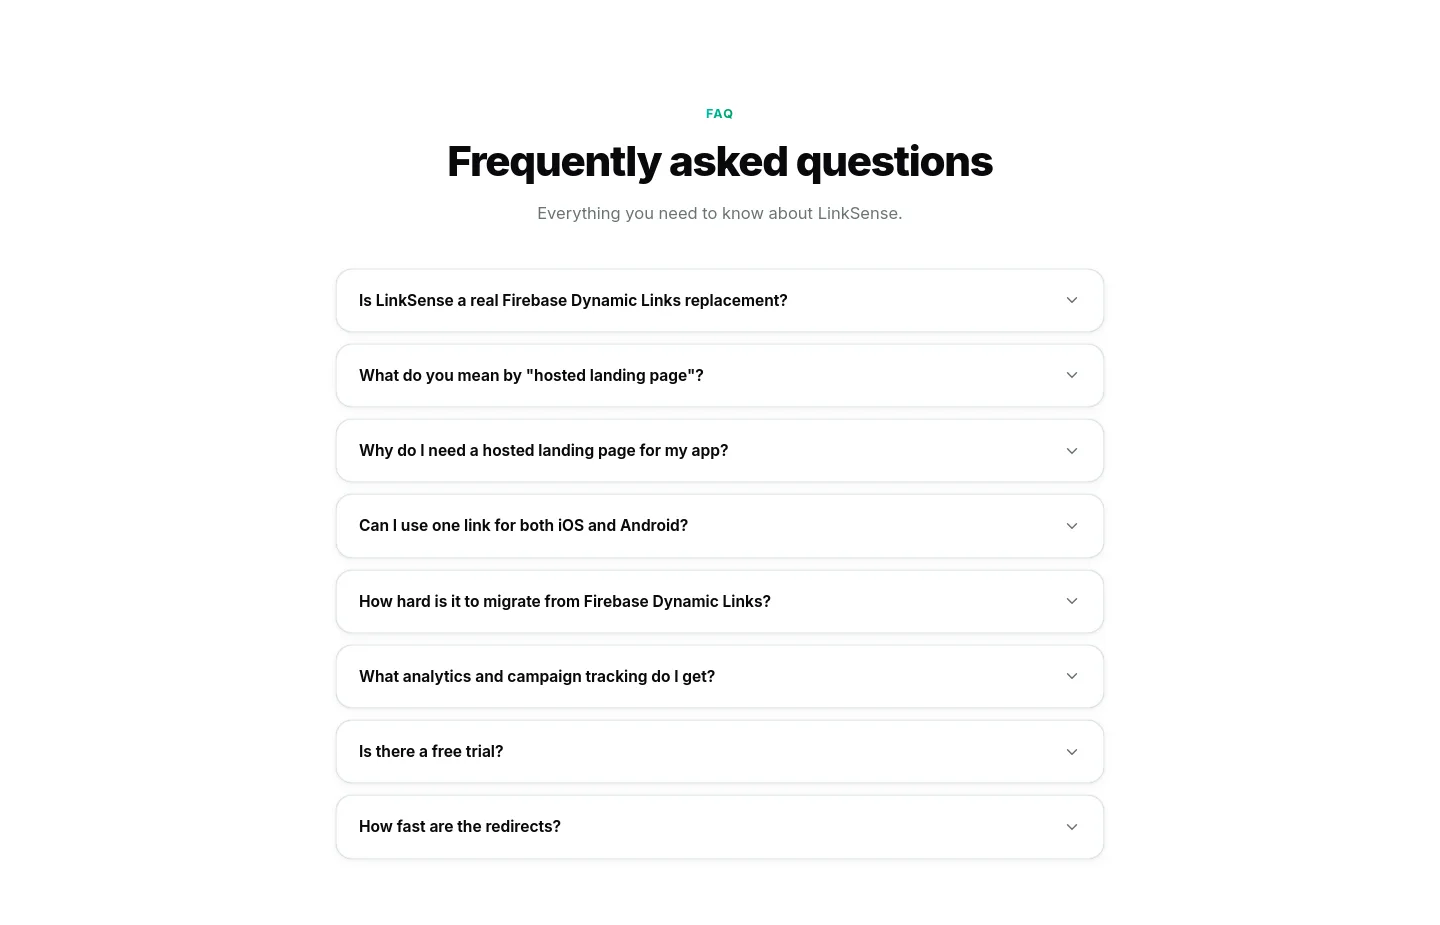
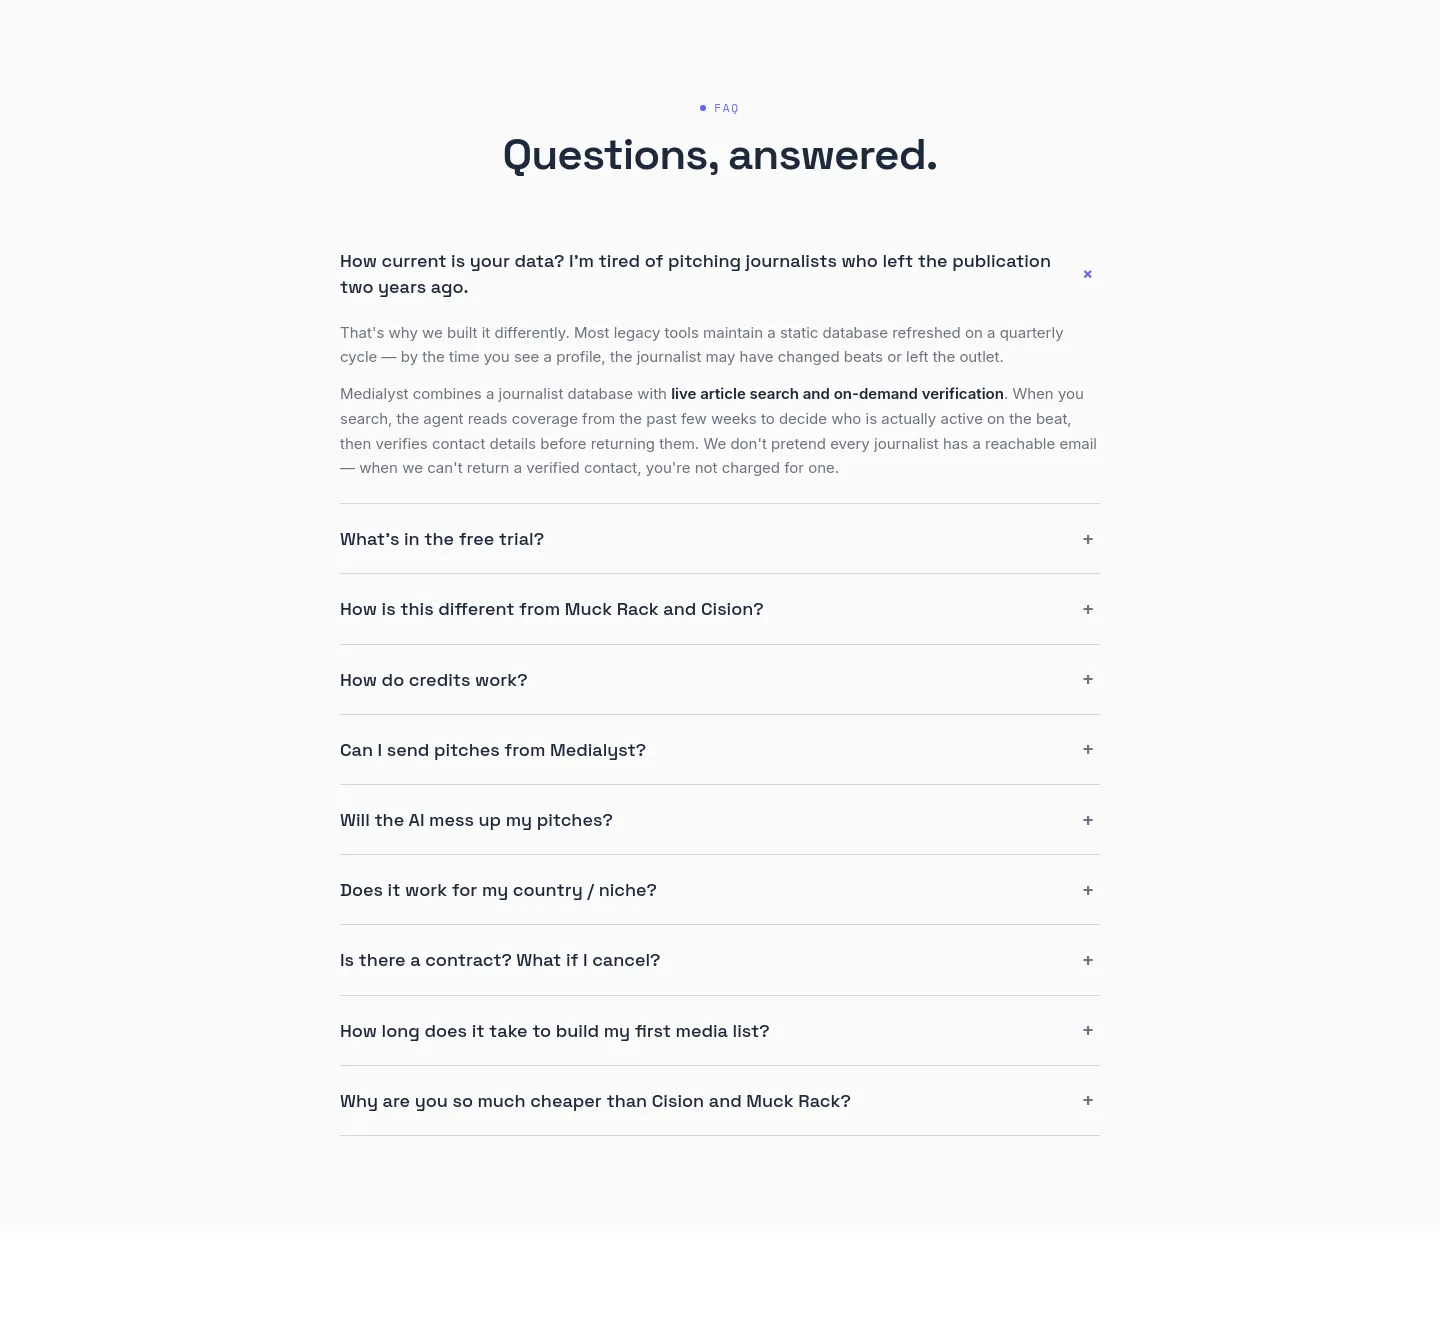
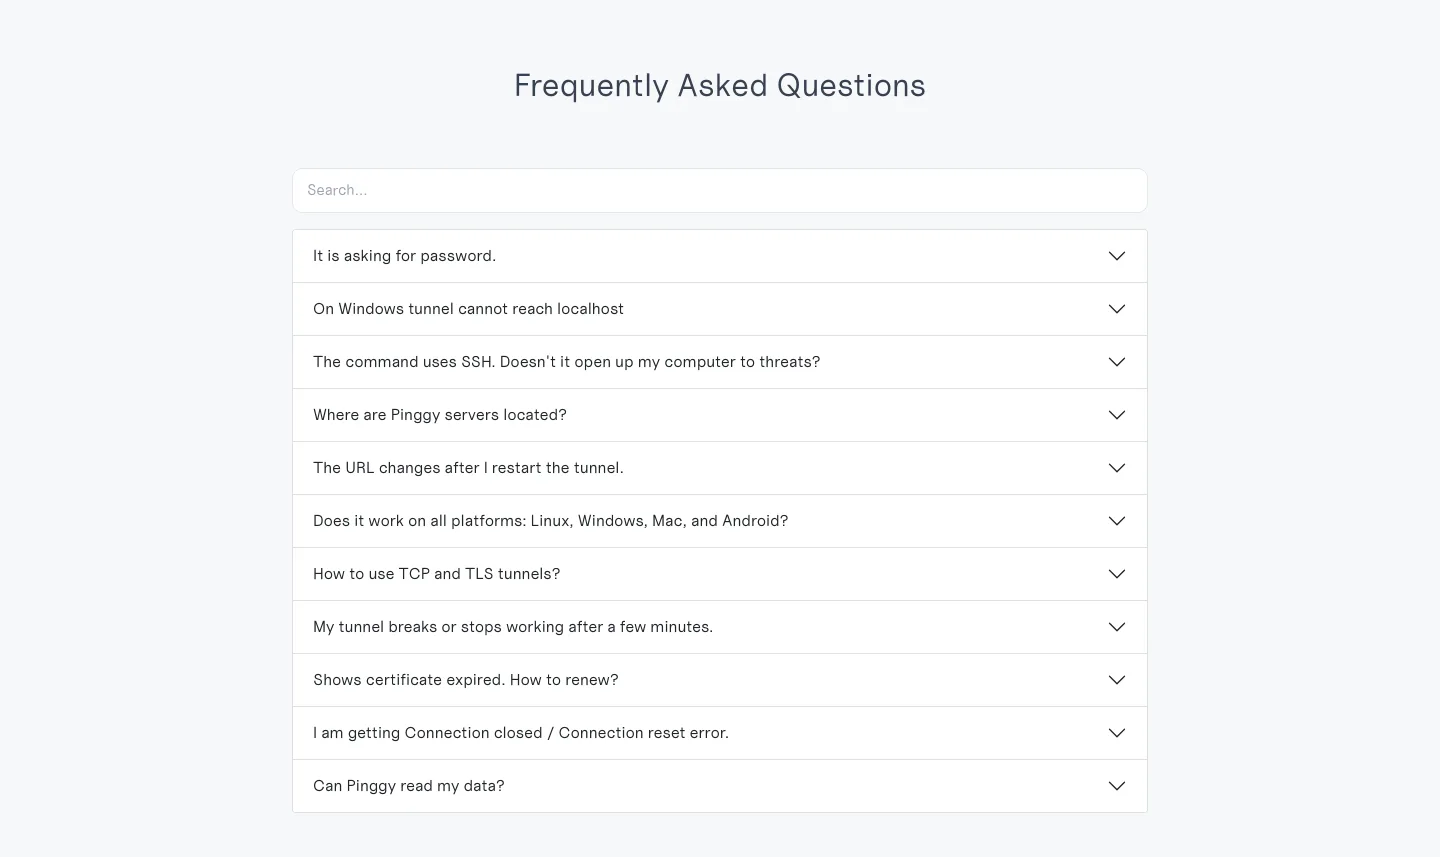
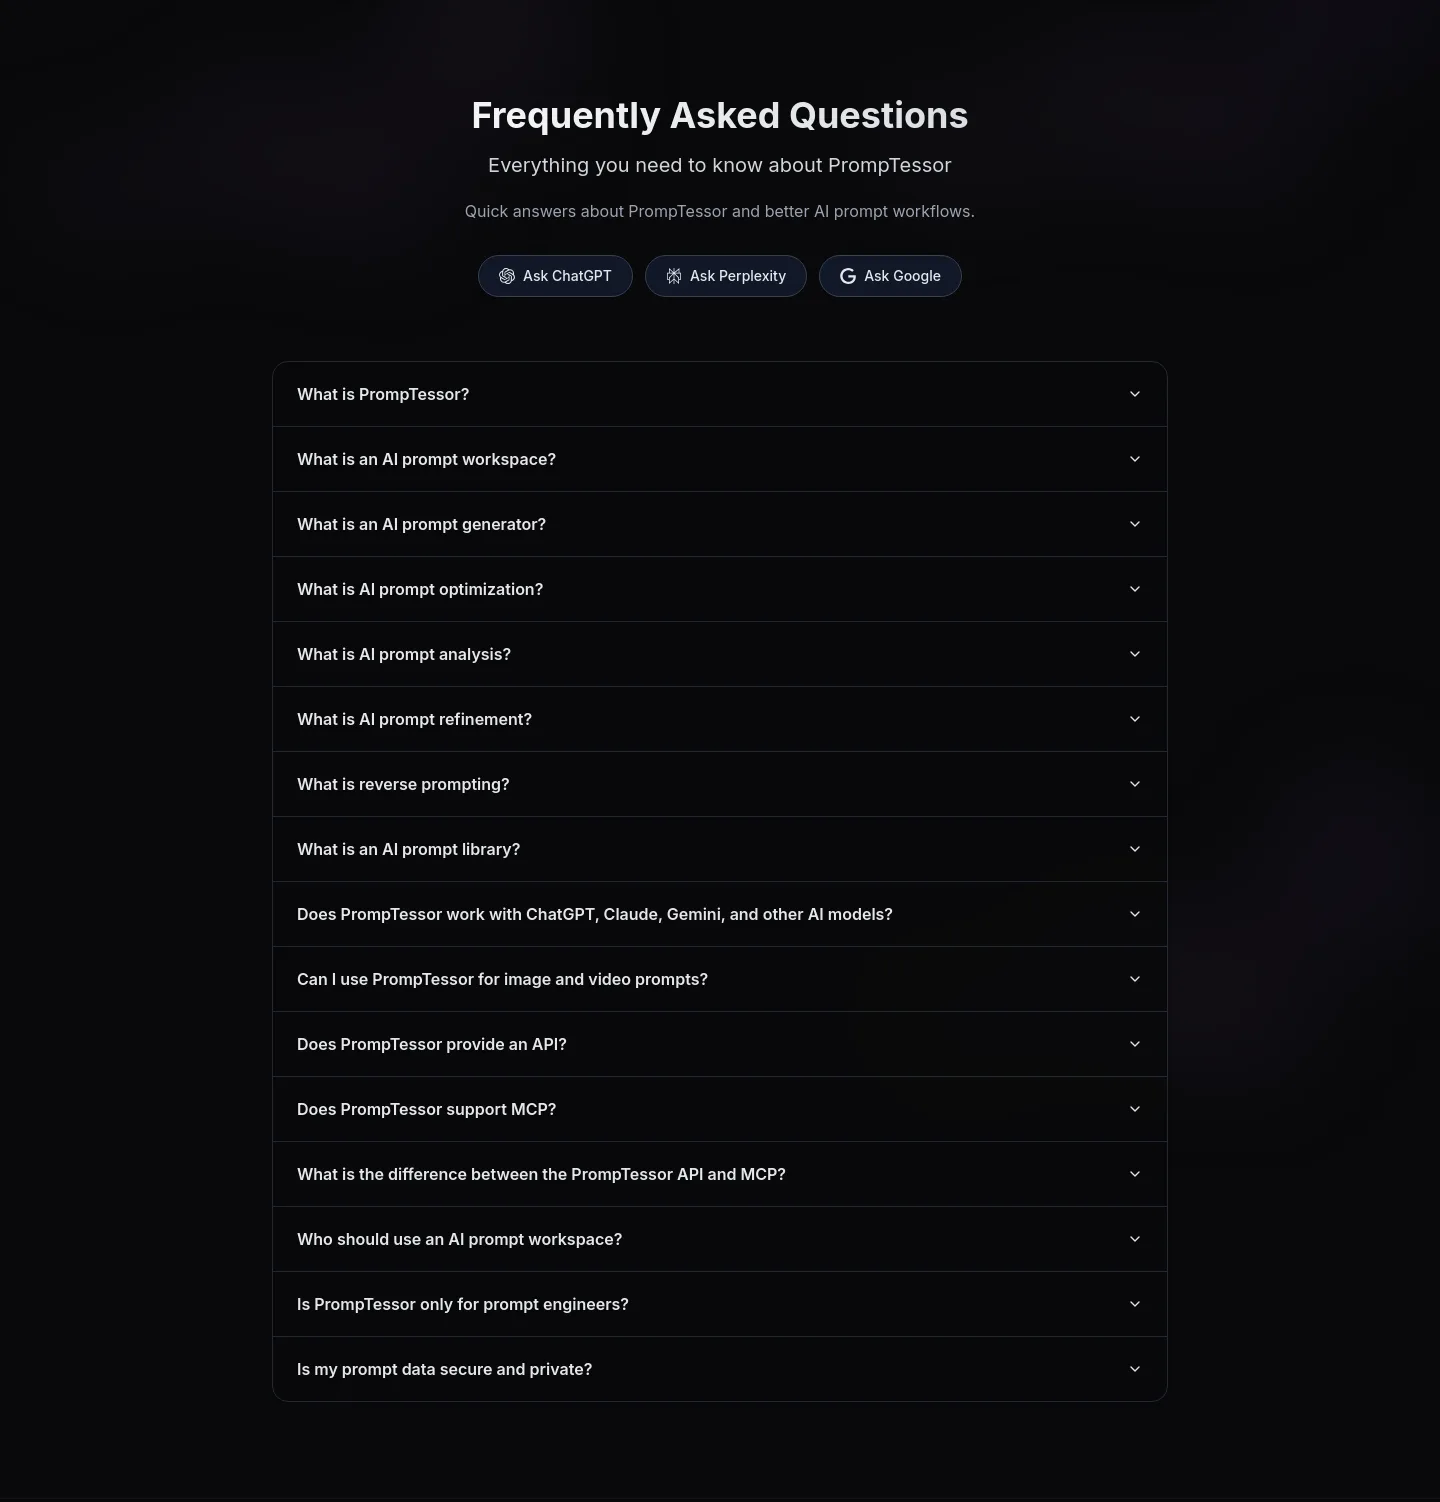
This gallery shows 1,814 real FAQs, cropped from 1,292 different sites, each cut from a live page’s full-page screenshot at the band’s measured position. 2,088 of the 3,919 fully measured pages carry at least one FAQ, which is 53%. Among the FAQs measured, the typical FAQ takes 12% of its page’s height (median of 1,817 measured) and the typical FAQ holds 97 words (median of 1,790 measured). 0% of the 1,760 FAQs whose heading level was measured open with an h1. Classification is deterministic, from the band’s own DOM signals, with no AI judgment. Every card opens the full measured band, and the broader measured range is on the matching research page. The corpus is seeded from launch directories, so read these counts as what UXXRAY measured, not as a sample of the whole web.
How this is measured
Each card is the actual faq band, cropped from a crawled page's full-page screenshot at its measured position — the highest-scoring funnels first.
Faq insights
- Typically 11.6% of the page tall across 1,817 sections
- Usually starts 72% of the way down across 1,817 sections
- Carries a median of 97 words across 1,790 sections
- Holds a median of 1 link across 565 sections
- Most often on a nav → hero → faq → footer page 399 of 1,817 pages
- pricing comes before faq 96% of the time 663 of 692 pages carrying both
- Guarantee — 1% 4 of the 531 FAQs we measured in SaaS funnels
Conversion tactics measured in FAQs
Share of FAQs we measured in SaaS funnels
Share of FAQs we measured in E-commerce funnels
A count, not a recommendation
Every rate is a lower bound: where the extractor found a tactic elsewhere on the same capture, that section leaves the denominator rather than counting as a miss, because only one position per tactic per page is recorded.
Page shapes, corpus-wide
34 page shapes cover half of the 3,290 pages we've measured. The most common is nav → hero → content → footer: 372 pages (11%). Measured across the funnels we've walked: SaaS 84% · E-commerce 12% · Affiliate 4% · Lead gen 1%.
How this is counted
The top 10 shapes cover 34% of pages. Its content element is the classifier’s terminal fallback (a band nothing else matched), not a named section. With that unnamed fallback removed from every sequence, 465 distinct shapes remain (down from 991 raw) and the top 10 cover 52%. Raw distinct counts move with detector coverage, not with design, so concentration is the number worth citing.
The pieces inside these: the Element Library. Back to all section designs. By industry, with the measured range: SaaS FAQ section examples.